Carousel with 6 slides shown one at a time. Use the Previous and Next buttons to navigate, or the tab buttons at the end to jump to specific slides. Tabbing to a control or slide will pause the carousel.


A health indicator is a measure designed to summarize information about a given priority topic in population health or health system performance. Health indicators provide comparable and actionable information across different geographic, organizational or administrative boundaries and/or can track progress over time.
We provide over 200 indicators, along with comparisons, trends and related data.
View all available indicators.
TOPIC AREAS
Explore data within one of our topic areas:
FEATURED RESOURCES
We've drawn together a diverse collection of professional resources for researchers, policy-makers, advocates, and other engaged citizens.
- Promising Practices - A database of documented approaches to improving community health and quality of life.
- Funding Opportunities - Regularly updated; opportunities are automatically removed when they expire.
- Location Report Builder - An easy way to tell the story of your community in a beautiful and simple report.
Search for health topics and keywords:
Monthly Focus: Alzheimer's/Dementia
Alzheimer’s Disease or Dementia: Medicare Population

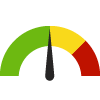


This indicator shows the percentage of Medicare beneficiaries who were treated for Alzheimer’s disease or dementia.
Medicare is the federal health insurance program for persons aged 65 years or older, persons under age 65 years with certain disabilities, and persons of any age with end-stage renal disease (ESRD).
Data Source: Centers for Medicare & Medicaid Services

Partners
Carousel with 3 slides shown one at a time. Each slide can contain up to 4 entries. Use the Previous and Next buttons to navigate. Tabbing to a control or slide entry will pause the carousel.