
Search for Indicators
Social Determinants of Health Dashboard
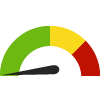
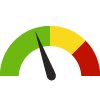
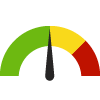
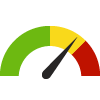
Indicator Gauge Icon Legend
Legend Colors
Red is bad, green is good, blue is not statistically different/neutral.
Compared to Distribution
 the value is in the best half of communities.
 the value is in the 2nd worst quarter of communities.
 the value is in the worst quarter of communities.
Compared to Target
 meets target;
  does not meet target.
Compared to a Single Value
 lower than the comparison value;
 higher than the comparison value;
 not statistically different from comparison value.
Trend

 non-significant change over time;
 significant change over time;
  no change over time.
Compared to Prior Value
 higher than the previous measurement period;
 lower than the previous measurement period;
 no statistically different change from previous measurement period.
State: Kansas
Employment
Value
Compared to:
State: Kansas Total Employment
State: Kansas Total Employment
1,188,432
Paid Employees
(2021)
Compared to:


Prior Value
(1,207,003)
Prior Value compares a measured value with the previously measured value. Confidence intervals were not taken into account in determining the direction of the comparison.
Trend
This comparison measures the indicator’s values over multiple time periods.<br>The Mann-Kendall Test for Statistical Significance is used to evaluate the trend<br>over 4 to 10 periods of measure, subject to data availability and comparability.
State: Kansas Unemployed Workers in Civilian Labor Force
State: Kansas Unemployed Workers in Civilian Labor Force
2.1%
(November 2023)
Compared to:
U.S. States
The distribution is based on non-seasonally-adjusted data from 50 U.S. states and the District of Columbia.
US Value
(3.5%)
The regional value is compared to the national value.
Prior Value
(3.1%)
Prior Value compares a measured value with the previously measured value. Confidence intervals were not taken into account in determining the direction of the comparison.
Trend
This comparison measures the indicator’s values over multiple time periods.<br>The Mann-Kendall Test for Statistical Significance is used to evaluate the trend<br>over 4 to 10 periods of measure, subject to data availability and comparability.
State: Kansas
Education
Value
Compared to:
State: Kansas Student-to-Teacher Ratio
State: Kansas Student-to-Teacher Ratio
12.9
Students per teacher
(2022-2023)
Compared to:

U.S. States
The distribution is based on data from 50 U.S. states and the District of Columbia.
US Value
(15.4)
The regional value is compared to the national value.
Prior Value
(12.7)
Prior Value compares a measured value with the previously measured value. Confidence intervals were not taken into account in determining the direction of the comparison.
Trend
This comparison measures the indicator’s values over multiple time periods.<br>The Mann-Kendall Test for Statistical Significance is used to evaluate the trend<br>over 4 to 10 periods of measure, subject to data availability and comparability.
State: Kansas 4th Grade Students Proficient in English/Language Arts
State: Kansas 4th Grade Students Proficient in English/Language Arts
42.8%
(2023)
Compared to:

Prior Value
(41.9%)
Prior Value compares a measured value with the previously measured value. Confidence intervals were not taken into account in determining the direction of the comparison.
Trend
This comparison measures the indicator’s values over multiple time periods.<br>The Mann-Kendall Test for Statistical Significance is used to evaluate the trend<br>over 4 to 10 periods of measure, subject to data availability and comparability.
State: Kansas 8th Grade Students Proficient in English/Language Arts
State: Kansas 8th Grade Students Proficient in English/Language Arts
20.8%
(2023)
Compared to:
Prior Value
(20.2%)
Prior Value compares a measured value with the previously measured value. Confidence intervals were not taken into account in determining the direction of the comparison.
Trend
This comparison measures the indicator’s values over multiple time periods.<br>The Mann-Kendall Test for Statistical Significance is used to evaluate the trend<br>over 4 to 10 periods of measure, subject to data availability and comparability.
State: Kansas High School Graduation
State: Kansas High School Graduation
89.1%
(2022)
Compared to:
Prior Value
(88.2%)
Prior Value compares a measured value with the previously measured value. Confidence intervals were not taken into account in determining the direction of the comparison.
Trend
This comparison measures the indicator’s values over multiple time periods.<br>The Mann-Kendall Test for Statistical Significance is used to evaluate the trend<br>over 4 to 10 periods of measure, subject to data availability and comparability.
HP 2030 Target
(90.7%)
State: Kansas People 25+ with a Bachelor's Degree or Higher
State: Kansas People 25+ with a Bachelor's Degree or Higher
34.7%
(2018-2022)
Compared to:
U.S. States
The distribution is based on data from 50 U.S. states and the District of Columbia.
US Value
(34.3%)
The regional value is compared to the national value.
Trend
This comparison measures the indicator’s values over multiple time periods.<br>The Mann-Kendall Test for Statistical Significance is used to evaluate the trend<br>over 4 to 10 periods of measure, subject to data availability and comparability.
State: Kansas People 25+ with a High School Diploma or Higher
State: Kansas People 25+ with a High School Diploma or Higher
91.8%
(2018-2022)
Compared to:
U.S. States
The distribution is based on data from 50 U.S. states and the District of Columbia.
US Value
(89.1%)
The regional value is compared to the national value.
Trend
This comparison measures the indicator’s values over multiple time periods.<br>The Mann-Kendall Test for Statistical Significance is used to evaluate the trend<br>over 4 to 10 periods of measure, subject to data availability and comparability.
State: Kansas
Language
Value
Compared to:
11.8%
(2018-2022)
Compared to:

US Value
(21.7%)
The regional value is compared to the national value.
Trend
This comparison measures the indicator’s values over multiple time periods.<br>The Mann-Kendall Test for Statistical Significance is used to evaluate the trend<br>over 4 to 10 periods of measure, subject to data availability and comparability.
State: Kansas
Poverty
Value
Compared to:
State: Kansas Children Living Below Poverty Level
State: Kansas Children Living Below Poverty Level
13.9%
(2018-2022)
Compared to:
U.S. States
The distribution is based on data from 50 U.S. states and the District of Columbia.
US Value
(16.7%)
The regional value is compared to the national value.
Trend
This comparison measures the indicator’s values over multiple time periods.<br>The Mann-Kendall Test for Statistical Significance is used to evaluate the trend<br>over 4 to 10 periods of measure, subject to data availability and comparability.
State: Kansas Households Living Below Poverty Level
State: Kansas Households Living Below Poverty Level
12.0%
(2021)
Compared to:
Prior Value
(12.2%)
Prior Value compares a measured value with the previously measured value. Confidence intervals were not taken into account in determining the direction of the comparison.
State: Kansas Families Living Below Poverty Level
State: Kansas Families Living Below Poverty Level
7.6%
(2018-2022)
Compared to:
U.S. States
The distribution is based on data from 50 U.S. states and the District of Columbia.
US Value
(8.8%)
The regional value is compared to the national value.
Trend
This comparison measures the indicator’s values over multiple time periods.<br>The Mann-Kendall Test for Statistical Significance is used to evaluate the trend<br>over 4 to 10 periods of measure, subject to data availability and comparability.
State: Kansas People 65+ Living Below Poverty Level
State: Kansas People 65+ Living Below Poverty Level
8.2%
(2018-2022)
Compared to:


U.S. States
The distribution is based on data from 50 U.S. states and the District of Columbia.
US Value
(10.0%)
The regional value is compared to the national value.
Trend
This comparison measures the indicator’s values over multiple time periods.<br>The Mann-Kendall Test for Statistical Significance is used to evaluate the trend<br>over 4 to 10 periods of measure, subject to data availability and comparability.
State: Kansas People Living 200% Above Poverty Level
State: Kansas People Living 200% Above Poverty Level
71.7%
(2018-2022)
Compared to:
U.S. States
The distribution is based on data from 50 U.S. states and the District of Columbia.
US Value
(71.2%)
The regional value is compared to the national value.
Trend
This comparison measures the indicator’s values over multiple time periods.<br>The Mann-Kendall Test for Statistical Significance is used to evaluate the trend<br>over 4 to 10 periods of measure, subject to data availability and comparability.
State: Kansas People Living Below Poverty Level
State: Kansas People Living Below Poverty Level
11.6%
(2018-2022)
Compared to:
U.S. States
The distribution is based on data from 50 U.S. states and the District of Columbia.
US Value
(12.5%)
The regional value is compared to the national value.
Trend
This comparison measures the indicator’s values over multiple time periods.<br>The Mann-Kendall Test for Statistical Significance is used to evaluate the trend<br>over 4 to 10 periods of measure, subject to data availability and comparability.
HP 2030 Target
(8.0%)
State: Kansas Young Children Living Below Poverty Level
State: Kansas Young Children Living Below Poverty Level
16.0%
(2018-2022)
Compared to:
U.S. States
The distribution is based on data from 50 U.S. states and the District of Columbia.
US Value
(18.1%)
The regional value is compared to the national value.
Trend
This comparison measures the indicator’s values over multiple time periods.<br>The Mann-Kendall Test for Statistical Significance is used to evaluate the trend<br>over 4 to 10 periods of measure, subject to data availability and comparability.
State: Kansas Students Eligible for the Free Lunch Program
State: Kansas Students Eligible for the Free Lunch Program
40.8%
(2022-2023)
Compared to:
U.S. States
The distribution is based on data from 43 U.S. states.
US Value
(42.8%)
The regional value is compared to the national value.
Prior Value
(33.5%)
Prior Value compares a measured value with the previously measured value. Confidence intervals were not taken into account in determining the direction of the comparison.
Trend
This comparison measures the indicator’s values over multiple time periods.<br>The Mann-Kendall Test for Statistical Significance is used to evaluate the trend<br>over 4 to 10 periods of measure, subject to data availability and comparability.
State: Kansas Households Receiving SNAP with Children
State: Kansas Households Receiving SNAP with Children
48.9%
(2018-2022)
Compared to:


US Value
(47.9%)
The regional value is compared to the national value.
Trend
This comparison measures the indicator’s values over multiple time periods.<br>The Mann-Kendall Test for Statistical Significance is used to evaluate the trend<br>over 4 to 10 periods of measure, subject to data availability and comparability.
State: Kansas Households with an Internet Subscription
State: Kansas Households with an Internet Subscription
88.2%
(2018-2022)
Compared to:

U.S. States
The distribution is based on data from 50 U.S. states and the District of Columbia.
US Value
(88.5%)
The regional value is compared to the national value.
Trend
This comparison measures the indicator’s values over multiple time periods.<br>The Mann-Kendall Test for Statistical Significance is used to evaluate the trend<br>over 4 to 10 periods of measure, subject to data availability and comparability.
State: Kansas
Housing
Value
Compared to:
State: Kansas Households with Cash Public Assistance Income
State: Kansas Households with Cash Public Assistance Income
1.8%
(2018-2022)
Compared to:
U.S. States
The distribution is based on data from 50 U.S. states and the District of Columbia.
US Value
(2.7%)
The regional value is compared to the national value.
Trend
This comparison measures the indicator’s values over multiple time periods.<br>The Mann-Kendall Test for Statistical Significance is used to evaluate the trend<br>over 4 to 10 periods of measure, subject to data availability and comparability.
State: Kansas Median Household Gross Rent
State: Kansas Median Household Gross Rent
$986
(2018-2022)
Compared to:

US Value
($1,268)
The regional value is compared to the national value.
Trend
This comparison measures the indicator’s values over multiple time periods.<br>The Mann-Kendall Test for Statistical Significance is used to evaluate the trend<br>over 4 to 10 periods of measure, subject to data availability and comparability.
State: Kansas Median Housing Unit Value
State: Kansas Median Housing Unit Value
$189,300
(2018-2022)
Compared to:
US Value
($281,900)
The regional value is compared to the national value.
Trend
This comparison measures the indicator’s values over multiple time periods.<br>The Mann-Kendall Test for Statistical Significance is used to evaluate the trend<br>over 4 to 10 periods of measure, subject to data availability and comparability.
State: Kansas Homeowner Vacancy Rate
State: Kansas Homeowner Vacancy Rate
1.3%
(2018-2022)
Compared to:

U.S. States
The distribution is based on data from 50 U.S. states and the District of Columbia.
US Value
(1.1%)
The regional value is compared to the national value.
Trend
This comparison measures the indicator’s values over multiple time periods.<br>The Mann-Kendall Test for Statistical Significance is used to evaluate the trend<br>over 4 to 10 periods of measure, subject to data availability and comparability.
State: Kansas Average Household Size
State: Kansas Average Household Size
2.50
Persons per household
(2018-2022)
Compared to:

US Value
(2.60)
The regional value is compared to the national value.
Trend
This comparison measures the indicator’s values over multiple time periods.<br>The Mann-Kendall Test for Statistical Significance is used to evaluate the trend<br>over 4 to 10 periods of measure, subject to data availability and comparability.
State: Kansas Mortgaged Owners Median Monthly Household Costs
State: Kansas Mortgaged Owners Median Monthly Household Costs
$1,580
(2018-2022)
Compared to:
US Value
($1,828)
The regional value is compared to the national value.
Trend
This comparison measures the indicator’s values over multiple time periods.<br>The Mann-Kendall Test for Statistical Significance is used to evaluate the trend<br>over 4 to 10 periods of measure, subject to data availability and comparability.
State: Kansas Renters Spending 30% or More of Household Income on Rent
State: Kansas Renters Spending 30% or More of Household Income on Rent
43.7%
(2018-2022)
Compared to:
U.S. States
The distribution is based on data from 50 U.S. states and the District of Columbia.
US Value
(49.9%)
The regional value is compared to the national value.
Trend
This comparison measures the indicator’s values over multiple time periods.<br>The Mann-Kendall Test for Statistical Significance is used to evaluate the trend<br>over 4 to 10 periods of measure, subject to data availability and comparability.
HP 2030 Target
(25.5%)
State: Kansas Severe Housing Problems
State: Kansas Severe Housing Problems
12.3%
(2016-2020)
Compared to:
U.S. States
The distribution is based on data from 50 U.S. states and the District of Columbia.
US Value
(16.7%)
The regional value is compared to the national value.
Prior Value
(12.5%)
Prior Value compares a measured value with the previously measured value. Confidence intervals were taken into account in determining the direction of the comparison.
Trend
This comparison measures the indicator’s values over multiple time periods.<br>The Mann-Kendall Test for Statistical Significance is used to evaluate the trend<br>over 4 to 10 periods of measure, subject to data availability and comparability.
State: Kansas Households without a Vehicle
State: Kansas Households without a Vehicle
5.1%
(2018-2022)
Compared to:
U.S. States
The distribution is based on data from 50 U.S. states and the District of Columbia.
US Value
(8.3%)
The regional value is compared to the national value.
Trend
This comparison measures the indicator’s values over multiple time periods.<br>The Mann-Kendall Test for Statistical Significance is used to evaluate the trend<br>over 4 to 10 periods of measure, subject to data availability and comparability.
State: Kansas
Misc
Value
Compared to:
State: Kansas Households with One or More Types of Computing Devices
State: Kansas Households with One or More Types of Computing Devices
94.2%
(2018-2022)
Compared to:
U.S. States
The distribution is based on data from 50 U.S. states and the District of Columbia.
US Value
(94.0%)
The regional value is compared to the national value.
Trend
This comparison measures the indicator’s values over multiple time periods.<br>The Mann-Kendall Test for Statistical Significance is used to evaluate the trend<br>over 4 to 10 periods of measure, subject to data availability and comparability.
State: Kansas Persons with a Disability
State: Kansas Persons with a Disability
13.4%
(2018-2022)
Compared to:
US Value
(12.9%)
The regional value is compared to the national value.
Trend
This comparison measures the indicator’s values over multiple time periods.<br>The Mann-Kendall Test for Statistical Significance is used to evaluate the trend<br>over 4 to 10 periods of measure, subject to data availability and comparability.
State: Kansas Rate of Violent Crime per 1,000 Population
State: Kansas Rate of Violent Crime per 1,000 Population
4.4
Crimes per 1,000 population
(2022)
Compared to:
US Value
(3.6 in 2014)
The Kansas State value is compared to the US value. Under reporting of crime by some public safety jurisdictions may result in lower rates.
Prior Value
(4.6)
Prior Value compares a measured value with the previously measured value. Confidence intervals were not taken into account in determining the direction of the comparison.
Trend
This comparison measures the indicator’s values over multiple time periods.<br>The Mann-Kendall Test for Statistical Significance is used to evaluate the trend<br>over 4 to 10 periods of measure, subject to data availability and comparability.
State: Kansas Access to Exercise Opportunities
State: Kansas Access to Exercise Opportunities
79.9%
(2024)
Compared to:
U.S. States
The distribution is based on data from 50 U.S. states and the District of Columbia.
US Value
(84.1%)
The regional value is compared to the national value.
Prior Value
(79.7%)
Prior Value compares a measured value with the previously measured value. Confidence intervals were not taken into account in determining the direction of the comparison.
61.0%
(2021)
Compared to:

Prior Value
(61.4%)
Prior Value compares a measured value with the previously measured value. Confidence intervals were not taken into account in determining the direction of the comparison.
27.0%
(2021)
Compared to:
Prior Value
(26.4%)
Prior Value compares a measured value with the previously measured value. Confidence intervals were not taken into account in determining the direction of the comparison.
100.0%
Percentage
(2021)
Compared to:
Prior Value
(100.0%)
Prior Value compares a measured value with the previously measured value. Confidence intervals were not taken into account in determining the direction of the comparison.
Trend
This comparison measures the indicator’s values over multiple time periods.<br>The Mann-Kendall Test for Statistical Significance is used to evaluate the trend<br>over 4 to 10 periods of measure, subject to data availability and comparability.
99.9%
Percentage
(2021)
Compared to:
Prior Value
(95.7%)
Prior Value compares a measured value with the previously measured value. Confidence intervals were not taken into account in determining the direction of the comparison.
Trend
This comparison measures the indicator’s values over multiple time periods.<br>The Mann-Kendall Test for Statistical Significance is used to evaluate the trend<br>over 4 to 10 periods of measure, subject to data availability and comparability.
State: Kansas People 65+ Living Alone
State: Kansas People 65+ Living Alone
28.8%
(2018-2022)
Compared to:

U.S. States
The distribution is based on data from 50 U.S. states and the District of Columbia.
US Value
(26.4%)
The regional value is compared to the national value.
Trend
This comparison measures the indicator’s values over multiple time periods.<br>The Mann-Kendall Test for Statistical Significance is used to evaluate the trend<br>over 4 to 10 periods of measure, subject to data availability and comparability.
State: Kansas People 65+ Living Alone (Count)
State: Kansas People 65+ Living Alone (Count)
137,903
People
(2018-2022)
Compared to:
Trend
This comparison measures the indicator’s values over multiple time periods.<br>The Mann-Kendall Test for Statistical Significance is used to evaluate the trend<br>over 4 to 10 periods of measure, subject to data availability and comparability.
