
Indicator Gauge Icon Legend
Legend Colors
Red is bad, green is good, blue is not statistically different/neutral.
Compared to Distribution
 the value is in the best half of communities.
 the value is in the 2nd worst quarter of communities.
 the value is in the worst quarter of communities.
Compared to Target
 meets target;
  does not meet target.
Compared to a Single Value
 lower than the comparison value;
 higher than the comparison value;
 not statistically different from comparison value.
Trend

 non-significant change over time;
 significant change over time;
  no change over time.
Compared to Prior Value
 higher than the previous measurement period;
 lower than the previous measurement period;
 no statistically different change from previous measurement period.
 Significantly better than the overall value
 Significantly worse than the overall value
 No significant difference with the overall value
 No data on significance available
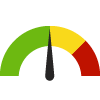
Households without a Vehicle
This indicator is archived and is no longer being updated. Click to learn more
This indicator shows the percentage of households that do not have a vehicle.
Numerator = Total estimate of housing units without vehicle
Denominator = Total estimate of occupied housing units
Why is this important?
Vehicle ownership is directly related to the ability to travel. In general, people living in a household without a car make fewer than half the number of journeys compared to those with a car. This limits their access to essential local services such as supermarkets, post offices, doctors' offices, and hospitals. Most households with above-average incomes have a car while only half of low-income households do.
Clear this location
County: Pratt
3.9%
Source:
American Community Survey 5-Year
Measurement period: 2018-2022
Maintained by: Conduent Healthy Communities Institute
Last update: February 2024
Measurement period: 2018-2022
Maintained by: Conduent Healthy Communities Institute
Last update: February 2024
Filter(s) for this location: Public Health Preparedness Region: South Central Coalition
Compared to

Technical note: The U.S. Census Bureau calculates 90% confidence intervals for American Community Survey estimates. Use caution when interpreting values with wide confidence intervals. Confidence intervals that are farther away from estimates in either direction indicate uncertainty due to small survey sample sizes.
The U.S. Census Bureau does not recommend comparing overlapping 5-year periods since much of the data in each estimate are the same. Use caution when comparing estimates for census tracts over time as these geographies are redefined with each decennial census according to population changes.
More details:
Data for this indicator can be found in tables DP04 (overall values) and B25045 (age breakout values) on data.census.gov.
Graph Selections

| County | Source | Measurement Period | Percent | |
|---|---|---|---|---|
There are 105 County values. The lowest value is 0.7%, and the highest value is 8.8%.
Half of the values are between 2.8% and 5.5%.
The middle (median) value is 4%.
Data Source
- American Community Survey 5-Year
Note: This source uses Zip Code Tabulation Areas (ZCTAs) for its Zip Code data. Learn more
Maintained By: Conduent Healthy Communities Institute (Methodology)
Filed under: Community / Transportation, Physical Determinants of Health, Social Determinants of Health