
Indicator Gauge Icon Legend
Legend Colors
Red is bad, green is good, blue is not statistically different/neutral.
Compared to Distribution
 the value is in the best half of communities.
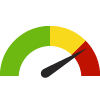
 the value is in the 2nd worst quarter of communities.
 the value is in the worst quarter of communities.
Compared to Target
 meets target;
  does not meet target.
Compared to a Single Value
 lower than the comparison value;
 higher than the comparison value;
 not statistically different from comparison value.
Trend

 non-significant change over time;
 significant change over time;
  no change over time.
Compared to Prior Value
 higher than the previous measurement period;
 lower than the previous measurement period;
 no statistically different change from previous measurement period.
 Significantly better than the overall value
 Significantly worse than the overall value
 No significant difference with the overall value
 No data on significance available
People 65+ Living Alone
State: Kansas
Measurement Period: 2018-2022
This indicator is archived and is no longer being updated. Click to learn more
This indicator shows the percentage of people aged 65 years and over who live alone.
Numerator = Total estimate of persons aged 65+ living alone
Denominator = Total population estimate aged 65+
Why is this important?
People over age 65 who live alone may be at risk for social isolation, limited access to support, or inadequate assistance in emergency situations. Older adults who do not live alone are most likely to live with a spouse, but they may also live with a child or other relative, a non-relative, or in group quarters. The Commonwealth Fund Commission on the Elderly Living Alone indicated that one third of older Americans live alone, and that one quarter of those living alone live in poverty and report poor health. Rates of living alone are typically higher in urban areas and among women. Older people living alone may lack social support, and are at high risk for institutionalization or losing their independent life style. Living alone should not be equated with being lonely or isolated, but many older people who live alone are vulnerable due to social isolation, poverty, disabilities, lack of access to care, or inadequate housing.
State: Kansas
28.8%
Source:
American Community Survey 5-Year
Measurement period: 2018-2022
Maintained by: Conduent Healthy Communities Institute
Last update: February 2024
Measurement period: 2018-2022
Maintained by: Conduent Healthy Communities Institute
Last update: February 2024
Compared to

Technical note: The U.S. Census Bureau calculates 90% confidence intervals for American Community Survey estimates. Use caution when interpreting values with wide confidence intervals. Confidence intervals that are farther away from estimates in either direction indicate uncertainty due to small survey sample sizes.
The U.S. Census Bureau does not recommend comparing overlapping 5-year periods since much of the data in each estimate are the same. Use caution when comparing estimates for census tracts over time as these geographies are redefined with each decennial census according to population changes.
Graph Selections

View maps, graphs, and tables for this indicator by selecting other location types (above).
Data Source
- American Community Survey 5-Year
Note: This source uses Zip Code Tabulation Areas (ZCTAs) for its Zip Code data. Learn more
Maintained By: Conduent Healthy Communities Institute (Methodology)
Filed under: Community / Social Environment, Health / Older Adults, Social Determinants of Health, Older Adults