
Search for Indicators
All Data
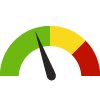
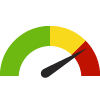
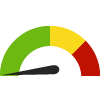
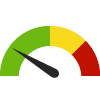
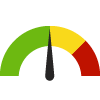
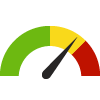
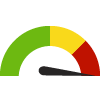
Indicator Gauge Icon Legend
Legend Colors
Red is bad, green is good, blue is not statistically different/neutral.
Compared to Distribution
 the value is in the best half of communities.
 the value is in the 2nd worst quarter of communities.
 the value is in the worst quarter of communities.
Compared to Target
 meets target;
  does not meet target.
Compared to a Single Value
 lower than the comparison value;
 higher than the comparison value;
 not statistically different from comparison value.
Trend

 non-significant change over time;
 significant change over time;
  no change over time.
Compared to Prior Value
 higher than the previous measurement period;
 lower than the previous measurement period;
 no statistically different change from previous measurement period.
County: Hodgeman
Health / Alcohol & Drug Use
Value
Compared to:
County: Hodgeman Adults who Binge Drink
County: Hodgeman Adults who Binge Drink
15.9%
(2021)
Compared to:

KS Counties
The distribution is based on data from 105 Kansas counties.
U.S. Counties
The distribution is based on data from 3,074 U.S. counties and county equivalents.
US Value
(15.5%)
The regional value is compared to the national value.
45.7%
(2017)
Compared to:

KS Value
(33.3%)
The regional value is compared to the Kansas State value.
Prior Value
(37.0%)
Prior Value compares a measured value with the previously measured value. Confidence intervals were not taken into account in determining the direction of the comparison.
Trend
This comparison measures the indicator’s values over multiple time periods.<br>The Mann-Kendall Test for Statistical Significance is used to evaluate the trend<br>over 4 to 10 periods of measure, subject to data availability and comparability.
26.7%
(2017)
Compared to:

KS Value
(16.6%)
The regional value is compared to the Kansas State value.
Prior Value
(22.2%)
Prior Value compares a measured value with the previously measured value. Confidence intervals were not taken into account in determining the direction of the comparison.
Trend
This comparison measures the indicator’s values over multiple time periods.<br>The Mann-Kendall Test for Statistical Significance is used to evaluate the trend<br>over 4 to 10 periods of measure, subject to data availability and comparability.
13.3%
(2017)
Compared to:
KS Value
(7.6%)
The regional value is compared to the Kansas State value.
Prior Value
(11.1%)
Prior Value compares a measured value with the previously measured value. Confidence intervals were not taken into account in determining the direction of the comparison.
19.1%
(2017)
Compared to:

KS Value
(15.1%)
The regional value is compared to the Kansas State value.
Prior Value
(9.9%)
Prior Value compares a measured value with the previously measured value. Confidence intervals were not taken into account in determining the direction of the comparison.
Trend
This comparison measures the indicator’s values over multiple time periods.<br>The Mann-Kendall Test for Statistical Significance is used to evaluate the trend<br>over 4 to 10 periods of measure, subject to data availability and comparability.
60.0%
(2017)
Compared to:
KS Value
(37.8%)
The regional value is compared to the Kansas State value.
Prior Value
(50.7%)
Prior Value compares a measured value with the previously measured value. Confidence intervals were not taken into account in determining the direction of the comparison.
Trend
This comparison measures the indicator’s values over multiple time periods.<br>The Mann-Kendall Test for Statistical Significance is used to evaluate the trend<br>over 4 to 10 periods of measure, subject to data availability and comparability.
83.3%
(2017)
Compared to:
KS Value
(71.0%)
The regional value is compared to the Kansas State value.
Prior Value
(82.7%)
Prior Value compares a measured value with the previously measured value. Confidence intervals were not taken into account in determining the direction of the comparison.
Trend
This comparison measures the indicator’s values over multiple time periods.<br>The Mann-Kendall Test for Statistical Significance is used to evaluate the trend<br>over 4 to 10 periods of measure, subject to data availability and comparability.
County: Hodgeman
Health / Cancer
Value
Compared to:
County: Hodgeman Adults with Cancer
County: Hodgeman Adults with Cancer
8.8%
(2021)
Compared to:
KS Counties
The distribution is based on data from 105 Kansas counties.
U.S. Counties
The distribution is based on data from 3,074 U.S. counties and county equivalents.
US Value
(7.0%)
The regional value is compared to the national value.
County: Hodgeman Cancer: Medicare Population
County: Hodgeman Cancer: Medicare Population
8.0%
(2022)
Compared to:
KS Counties
The distribution is based on data from 105 Kansas counties.
U.S. Counties
The distribution is based on data from 3,129 U.S. counties and county equivalents.
KS Value
(11.0%)
The regional value is compared to the Kansas State value.
US Value
(12.0%)
The regional value is compared to the national value.
Prior Value
(9.0%)
Prior Value compares a measured value with the previously measured value. Confidence intervals were not taken into account in determining the direction of the comparison.
Trend
This comparison measures the indicator’s values over multiple time periods.<br>The Mann-Kendall Test for Statistical Significance is used to evaluate the trend<br>over 4 to 10 periods of measure, subject to data availability and comparability.
County: Hodgeman Cervical Cancer Screening: 21-65
County: Hodgeman Cervical Cancer Screening: 21-65
82.4%
(2020)
Compared to:


KS Counties
The distribution is based on data from 105 Kansas counties.
U.S. Counties
The distribution is based on data from 3,141 U.S. counties and county equivalents.
US Value
(82.8%)
The regional value is compared to the national value.
County: Hodgeman Colon Cancer Screening
County: Hodgeman Colon Cancer Screening
63.0%
(2018)
Compared to:
KS Counties
The distribution is based on data from 105 Kansas counties.
U.S. Counties
The distribution is based on data from 3,142 U.S. counties and county equivalents.
US Value
(66.4%)
The regional value is compared to the national value.
County: Hodgeman Colon Cancer Screening: USPSTF Recommendation
County: Hodgeman Colon Cancer Screening: USPSTF Recommendation
69.2%
(2020)
Compared to:
KS Counties
The distribution is based on data from 105 Kansas counties.
U.S. Counties
The distribution is based on data from 3,141 U.S. counties and county equivalents.
US Value
(72.4%)
The regional value is compared to the national value.
County: Hodgeman Colorectal Cancer Rate
County: Hodgeman Colorectal Cancer Rate
16.3
Per 100,000 population
(2014-2018)
Compared to:
KS Value
(39.2)
The regional value is compared to the Kansas State value.
Prior Value
(56.9)
Prior Value compares a measured value with the previously measured value. Confidence intervals were taken into account in determining the direction of the comparison.
County: Hodgeman Female Breast Cancer Rate
County: Hodgeman Female Breast Cancer Rate
120.5
Per 100,000 female population
(2014-2018)
Compared to:
KS Value
(129.0)
The regional value is compared to the Kansas State value.
Prior Value
(124.8)
Prior Value compares a measured value with the previously measured value. Confidence intervals were taken into account in determining the direction of the comparison.
Trend
This comparison measures the indicator’s values over multiple time periods.<br>The Mann-Kendall Test for Statistical Significance is used to evaluate the trend<br>over 4 to 10 periods of measure, subject to data availability and comparability.
County: Hodgeman Lung & Bronchus Cancer Rate
County: Hodgeman Lung & Bronchus Cancer Rate
58.9
Per 100,000 population
(2014-2018)
Compared to:
KS Value
(54.0)
The regional value is compared to the Kansas State value.
Prior Value
(74.4)
Prior Value compares a measured value with the previously measured value. Confidence intervals were not taken into account in determining the direction of the comparison.
Trend
This comparison measures the indicator’s values over multiple time periods.<br>The Mann-Kendall Test for Statistical Significance is used to evaluate the trend<br>over 4 to 10 periods of measure, subject to data availability and comparability.
County: Hodgeman Male Prostate Cancer Rate
County: Hodgeman Male Prostate Cancer Rate
120.5
Per 100,000 male population
(2014-2018)
Compared to:
KS Value
(109.8)
The regional value is compared to the Kansas State value.
Prior Value
(162.5)
Prior Value compares a measured value with the previously measured value. Confidence intervals were taken into account in determining the direction of the comparison.
Trend
This comparison measures the indicator’s values over multiple time periods.<br>The Mann-Kendall Test for Statistical Significance is used to evaluate the trend<br>over 4 to 10 periods of measure, subject to data availability and comparability.
County: Hodgeman Mammogram in Past 2 Years: 50-74
County: Hodgeman Mammogram in Past 2 Years: 50-74
69.3%
(2020)
Compared to:
KS Counties
The distribution is based on data from 105 Kansas counties.
U.S. Counties
The distribution is based on data from 3,141 U.S. counties and county equivalents.
US Value
(78.2%)
The regional value is compared to the national value.
HP 2030 Target
(80.3%)
County: Hodgeman Mammography Screening: Medicare Population
County: Hodgeman Mammography Screening: Medicare Population
52.0%
(2022)
Compared to:

KS Counties
The distribution is based on data from 105 Kansas counties.
U.S. Counties
The distribution is based on data from 3,123 U.S. counties and county equivalents.
KS Value
(50.0%)
The regional value is compared to the Kansas State value.
US Value
(47.0%)
The regional value is compared to the national value.
Prior Value
(56.0%)
Prior Value compares a measured value with the previously measured value. Confidence intervals were not taken into account in determining the direction of the comparison.
Trend
This comparison measures the indicator’s values over multiple time periods.<br>The Mann-Kendall Test for Statistical Significance is used to evaluate the trend<br>over 4 to 10 periods of measure, subject to data availability and comparability.
County: Hodgeman
Health / Diabetes
Value
Compared to:
County: Hodgeman Adults 20+ with Diabetes
County: Hodgeman Adults 20+ with Diabetes
7.2%
(2021)
Compared to:
KS Counties
The distribution is based on data from 105 Kansas counties.
U.S. Counties
The distribution is based on data from 3,074 U.S. counties and county equivalents.
Prior Value
(7.3%)
Prior Value compares a measured value with the previously measured value. Confidence intervals were taken into account in determining the direction of the comparison.
Trend
This comparison measures the indicator’s values over multiple time periods.<br>The Mann-Kendall Test for Statistical Significance is used to evaluate the trend<br>over 4 to 10 periods of measure, subject to data availability and comparability.
County: Hodgeman Diabetes Hospital Admission Rate
County: Hodgeman Diabetes Hospital Admission Rate
16.0
Per 10,000 population
(2018-2020)
Compared to:
KS Value
(16.5)
The regional value is compared to the Kansas State value.
Prior Value
(11.2)
Prior Value compares a measured value with the previously measured value. Confidence intervals were taken into account in determining the direction of the comparison.
County: Hodgeman Diabetes: Medicare Population
County: Hodgeman Diabetes: Medicare Population
23.0%
(2022)
Compared to:
KS Counties
The distribution is based on data from 105 Kansas counties.
U.S. Counties
The distribution is based on data from 3,129 U.S. counties and county equivalents.
KS Value
(24.0%)
The regional value is compared to the Kansas State value.
US Value
(24.0%)
The regional value is compared to the national value.
Prior Value
(24.0%)
Prior Value compares a measured value with the previously measured value. Confidence intervals were not taken into account in determining the direction of the comparison.
Trend
This comparison measures the indicator’s values over multiple time periods.<br>The Mann-Kendall Test for Statistical Significance is used to evaluate the trend<br>over 4 to 10 periods of measure, subject to data availability and comparability.
County: Hodgeman
Health / Disabilities
Value
Compared to:
County: Hodgeman Adults with Disability Living in Poverty
County: Hodgeman Adults with Disability Living in Poverty
15.0%
(2018-2022)
Compared to:
KS Counties
The distribution is based on data from 105 Kansas counties.
U.S. Counties
The distribution is based on data from 3,132 U.S. counties and county equivalents.
KS Value
(24.6%)
The regional value is compared to the Kansas State value.
US Value
(24.9%)
The regional value is compared to the national value.
Trend
This comparison measures the indicator’s values over multiple time periods.<br>The Mann-Kendall Test for Statistical Significance is used to evaluate the trend<br>over 4 to 10 periods of measure, subject to data availability and comparability.
County: Hodgeman Children with a Disability
County: Hodgeman Children with a Disability
11.7%
(2018-2022)
Compared to:


KS Value
(4.8%)
The regional value is compared to the Kansas State value.
US Value
(4.5%)
The regional value is compared to the national value.
Trend
This comparison measures the indicator’s values over multiple time periods.<br>The Mann-Kendall Test for Statistical Significance is used to evaluate the trend<br>over 4 to 10 periods of measure, subject to data availability and comparability.
County: Hodgeman Persons with a Cognitive Difficulty
County: Hodgeman Persons with a Cognitive Difficulty
7.8%
(2018-2022)
Compared to:

KS Value
(5.6%)
The regional value is compared to the Kansas State value.
US Value
(5.3%)
The regional value is compared to the national value.
Trend
This comparison measures the indicator’s values over multiple time periods.<br>The Mann-Kendall Test for Statistical Significance is used to evaluate the trend<br>over 4 to 10 periods of measure, subject to data availability and comparability.
County: Hodgeman Persons with a Disability
County: Hodgeman Persons with a Disability
17.1%
(2018-2022)
Compared to:

KS Value
(13.4%)
The regional value is compared to the Kansas State value.
US Value
(12.9%)
The regional value is compared to the national value.
Trend
This comparison measures the indicator’s values over multiple time periods.<br>The Mann-Kendall Test for Statistical Significance is used to evaluate the trend<br>over 4 to 10 periods of measure, subject to data availability and comparability.
County: Hodgeman Persons with a Hearing Difficulty
County: Hodgeman Persons with a Hearing Difficulty
8.7%
(2018-2022)
Compared to:
KS Value
(4.2%)
The regional value is compared to the Kansas State value.
US Value
(3.6%)
The regional value is compared to the national value.
Trend
This comparison measures the indicator’s values over multiple time periods.<br>The Mann-Kendall Test for Statistical Significance is used to evaluate the trend<br>over 4 to 10 periods of measure, subject to data availability and comparability.
County: Hodgeman Persons with a Self-Care Difficulty
County: Hodgeman Persons with a Self-Care Difficulty
2.3%
(2018-2022)
Compared to:

KS Value
(2.2%)
The regional value is compared to the Kansas State value.
US Value
(2.6%)
The regional value is compared to the national value.
Trend
This comparison measures the indicator’s values over multiple time periods.<br>The Mann-Kendall Test for Statistical Significance is used to evaluate the trend<br>over 4 to 10 periods of measure, subject to data availability and comparability.
County: Hodgeman Persons with a Vision Difficulty
County: Hodgeman Persons with a Vision Difficulty
3.6%
(2018-2022)
Compared to:
KS Value
(2.4%)
The regional value is compared to the Kansas State value.
US Value
(2.4%)
The regional value is compared to the national value.
Trend
This comparison measures the indicator’s values over multiple time periods.<br>The Mann-Kendall Test for Statistical Significance is used to evaluate the trend<br>over 4 to 10 periods of measure, subject to data availability and comparability.
County: Hodgeman Persons with an Ambulatory Difficulty
County: Hodgeman Persons with an Ambulatory Difficulty
7.3%
(2018-2022)
Compared to:
KS Value
(6.5%)
The regional value is compared to the Kansas State value.
US Value
(6.7%)
The regional value is compared to the national value.
Trend
This comparison measures the indicator’s values over multiple time periods.<br>The Mann-Kendall Test for Statistical Significance is used to evaluate the trend<br>over 4 to 10 periods of measure, subject to data availability and comparability.
County: Hodgeman
Health / Health Care Access & Quality
Value
Compared to:
County: Hodgeman Adults who have had a Routine Checkup
County: Hodgeman Adults who have had a Routine Checkup
74.6%
(2021)
Compared to:
KS Counties
The distribution is based on data from 105 Kansas counties.
U.S. Counties
The distribution is based on data from 3,074 U.S. counties and county equivalents.
US Value
(73.6%)
The regional value is compared to the national value.
County: Hodgeman Adults without Health Insurance
County: Hodgeman Adults without Health Insurance
9.9%
(2021)
Compared to:
KS Counties
The distribution is based on data from 105 Kansas counties.
U.S. Counties
The distribution is based on data from 3,074 U.S. counties and county equivalents.
US Value
(10.8%)
The regional value is compared to the national value.
County: Hodgeman Average Monthly WIC Participation per 1,000 population
County: Hodgeman Average Monthly WIC Participation per 1,000 population
9.1
Average cases per 1,000 population
(2023)
Compared to:


KS Value
(16.0)
The regional value is compared to the Kansas State value.
US Value
(22.4 in 2017)
The Kansas State value is compared to the U.S. value.
Prior Value
(9.9)
Prior Value compares a measured value with the previously measured value. Confidence intervals were not taken into account in determining the direction of the comparison.
Trend
This comparison measures the indicator’s values over multiple time periods.<br>The Mann-Kendall Test for Statistical Significance is used to evaluate the trend<br>over 4 to 10 periods of measure, subject to data availability and comparability.
County: Hodgeman Community Spending on Health Care
County: Hodgeman Community Spending on Health Care
11.2%
(2023)
Compared to:
KS Value
(8.6%)
The regional value is compared to the Kansas State value.
US Value
(8.0%)
The regional value is compared to the national value.
Prior Value
(11.2%)
Prior Value compares a measured value with the previously measured value. Confidence intervals were not taken into account in determining the direction of the comparison.
County: Hodgeman Health Insurance Spending-to-Income Ratio
County: Hodgeman Health Insurance Spending-to-Income Ratio
7.4%
(2023)
Compared to:
KS Counties
The distribution is based on data from 105 Kansas counties.
U.S. Counties
The distribution is based on data from 3,141 U.S. counties and county equivalents.
KS Value
(6.8%)
The regional value is compared to the Kansas State value.
Prior Value
(7.8%)
Prior Value compares a measured value with the previously measured value. Confidence intervals were not taken into account in determining the direction of the comparison.
County: Hodgeman Non-Physician Primary Care Provider Rate
County: Hodgeman Non-Physician Primary Care Provider Rate
342
Providers per 100,000 population
(2023)
Compared to:
KS Counties
The distribution is based on data from 105 Kansas counties.
U.S. Counties
The distribution is based on data from 3,129 U.S. counties and county equivalents.
KS Value
(149)
The regional value is compared to the Kansas State value.
Prior Value
(351)
Prior Value compares a measured value with the previously measured value. Confidence intervals were not taken into account in determining the direction of the comparison.
Trend
This comparison measures the indicator’s values over multiple time periods.<br>The Mann-Kendall Test for Statistical Significance is used to evaluate the trend<br>over 4 to 10 periods of measure, subject to data availability and comparability.
County: Hodgeman Persons with Health Insurance
County: Hodgeman Persons with Health Insurance
85.9%
(2021)
Compared to:

KS Counties
The distribution is based on data from 105 Kansas counties.
U.S. Counties
The distribution is based on data from 3,140 U.S. counties and county equivalents.
KS Value
(89.1%)
The regional value is compared to the Kansas State value.
Prior Value
(85.6%)
Prior Value compares a measured value with the previously measured value. Confidence intervals were taken into account in determining the direction of the comparison.
Trend
This comparison measures the indicator’s values over multiple time periods.<br>The Mann-Kendall Test for Statistical Significance is used to evaluate the trend<br>over 4 to 10 periods of measure, subject to data availability and comparability.
HP 2030 Target
(92.4%)
<div>AHS-01: Increase the proportion of people with health insurance <strong>(LEADING HEALTH INDICATOR)</strong></div>
County: Hodgeman Preventable Hospital Stays: Medicare Population
County: Hodgeman Preventable Hospital Stays: Medicare Population
5,911.0
Discharges per 100,000 Medicare enrollees
(2022)
Compared to:
KS Counties
The distribution is based on data from 105 Kansas counties.
U.S. Counties
The distribution is based on data from 3,129 U.S. counties and county equivalents.
KS Value
(2,527.0)
The regional value is compared to the Kansas State value.
US Value
(2,677.0)
The regional value is compared to the national value.
Prior Value
(4,393.0)
Prior Value compares a measured value with the previously measured value. Confidence intervals were not taken into account in determining the direction of the comparison.
Trend
This comparison measures the indicator’s values over multiple time periods.<br>The Mann-Kendall Test for Statistical Significance is used to evaluate the trend<br>over 4 to 10 periods of measure, subject to data availability and comparability.
County: Hodgeman Primary Care Provider Rate
County: Hodgeman Primary Care Provider Rate
117
Providers per 100,000 population
(2021)
Compared to:
KS Counties
The distribution is based on data from 95 Kansas counties.
U.S. Counties
The distribution is based on data from 2,984 U.S. counties and county equivalents.
KS Value
(78)
The regional value is compared to the Kansas State value.
Prior Value
(112)
Prior Value compares a measured value with the previously measured value. Confidence intervals were not taken into account in determining the direction of the comparison.
Trend
This comparison measures the indicator’s values over multiple time periods.<br>The Mann-Kendall Test for Statistical Significance is used to evaluate the trend<br>over 4 to 10 periods of measure, subject to data availability and comparability.
County: Hodgeman Staffed Hospital Bed Ratio
County: Hodgeman Staffed Hospital Bed Ratio
4.7
Beds per 1,000 population
(2022)
Compared to:
KS Value
(2.7)
The regional value is compared to the Kansas State value.
Prior Value
(4.7)
Prior Value compares a measured value with the previously measured value. Confidence intervals were not taken into account in determining the direction of the comparison.
Trend
This comparison measures the indicator’s values over multiple time periods.<br>The Mann-Kendall Test for Statistical Significance is used to evaluate the trend<br>over 4 to 10 periods of measure, subject to data availability and comparability.
County: Hodgeman
Health / Health Information Technology
Value
Compared to:
County: Hodgeman Households with an Internet Subscription
County: Hodgeman Households with an Internet Subscription
78.3%
(2018-2022)
Compared to:
KS Counties
The distribution is based on data from 105 Kansas counties.
U.S. Counties
The distribution is based on data from 3,133 U.S. counties and county equivalents.
KS Value
(88.2%)
The regional value is compared to the Kansas State value.
US Value
(88.5%)
The regional value is compared to the national value.
Trend
This comparison measures the indicator’s values over multiple time periods.<br>The Mann-Kendall Test for Statistical Significance is used to evaluate the trend<br>over 4 to 10 periods of measure, subject to data availability and comparability.
County: Hodgeman Households with One or More Types of Computing Devices
County: Hodgeman Households with One or More Types of Computing Devices
85.5%
(2018-2022)
Compared to:
KS Counties
The distribution is based on data from 105 Kansas counties.
U.S. Counties
The distribution is based on data from 3,133 U.S. counties and county equivalents.
KS Value
(94.2%)
The regional value is compared to the Kansas State value.
US Value
(94.0%)
The regional value is compared to the national value.
Trend
This comparison measures the indicator’s values over multiple time periods.<br>The Mann-Kendall Test for Statistical Significance is used to evaluate the trend<br>over 4 to 10 periods of measure, subject to data availability and comparability.
County: Hodgeman Persons with an Internet Subscription
County: Hodgeman Persons with an Internet Subscription
87.3%
(2018-2022)
Compared to:
KS Counties
The distribution is based on data from 105 Kansas counties.
U.S. Counties
The distribution is based on data from 3,133 U.S. counties and county equivalents.
KS Value
(91.1%)
The regional value is compared to the Kansas State value.
US Value
(91.0%)
The regional value is compared to the national value.
Trend
This comparison measures the indicator’s values over multiple time periods.<br>The Mann-Kendall Test for Statistical Significance is used to evaluate the trend<br>over 4 to 10 periods of measure, subject to data availability and comparability.
County: Hodgeman
Health / Heart Disease & Stroke
Value
Compared to:
County: Hodgeman Acute Cerebrovascular (Stroke) Disease Hospital Admission Rate
County: Hodgeman Acute Cerebrovascular (Stroke) Disease Hospital Admission Rate
14.7
Per 10,000 population
(2018-2020)
Compared to:
KS Value
(11.6)
The regional value is compared to the Kansas State value.
Prior Value
(15.7)
Prior Value compares a measured value with the previously measured value. Confidence intervals were taken into account in determining the direction of the comparison.
County: Hodgeman Adults who Experienced a Stroke
County: Hodgeman Adults who Experienced a Stroke
3.5%
(2021)
Compared to:
KS Counties
The distribution is based on data from 105 Kansas counties.
U.S. Counties
The distribution is based on data from 3,074 U.S. counties and county equivalents.
US Value
(3.3%)
The regional value is compared to the national value.
County: Hodgeman Adults who Experienced Coronary Heart Disease
County: Hodgeman Adults who Experienced Coronary Heart Disease
7.7%
(2021)
Compared to:
KS Counties
The distribution is based on data from 105 Kansas counties.
U.S. Counties
The distribution is based on data from 3,074 U.S. counties and county equivalents.
US Value
(6.1%)
The regional value is compared to the national value.
County: Hodgeman Adults who Have Taken Medications for High Blood Pressure
County: Hodgeman Adults who Have Taken Medications for High Blood Pressure
82.1%
(2021)
Compared to:
KS Counties
The distribution is based on data from 105 Kansas counties.
U.S. Counties
The distribution is based on data from 3,074 U.S. counties and county equivalents.
US Value
(78.2%)
The regional value is compared to the national value.
County: Hodgeman Age-Adjusted Death Rate due to Heart Attack
County: Hodgeman Age-Adjusted Death Rate due to Heart Attack
84.8
Deaths per 100,000 population 35+ years
(2016)
Compared to:
KS Counties
The distribution is based on data from 104 Kansas counties.
KS Value
(48.3)
The regional value is compared to the Kansas State value.
Prior Value
(91.6)
Prior Value compares a measured value with the previously measured value. Confidence intervals were not taken into account in determining the direction of the comparison.
Trend
This comparison measures the indicator’s values over multiple time periods.<br>The Mann-Kendall Test for Statistical Significance is used to evaluate the trend<br>over 4 to 10 periods of measure, subject to data availability and comparability.
County: Hodgeman Age-Adjusted Hospitalization Rate due to Heart Attack
County: Hodgeman Age-Adjusted Hospitalization Rate due to Heart Attack
25.0
Hospitalizations per 10,000 population 35+ years
(2015)
Compared to:
KS Counties
The distribution is based on data from 105 Kansas counties.
KS Value
(25.6)
The regional value is compared to the Kansas State value.
Prior Value
(19.5)
Prior Value compares a measured value with the previously measured value. Confidence intervals were not taken into account in determining the direction of the comparison.
County: Hodgeman Atrial Fibrillation: Medicare Population
County: Hodgeman Atrial Fibrillation: Medicare Population
17.0%
(2022)
Compared to:
KS Counties
The distribution is based on data from 105 Kansas counties.
U.S. Counties
The distribution is based on data from 3,129 U.S. counties and county equivalents.
KS Value
(15.0%)
The regional value is compared to the Kansas State value.
US Value
(14.0%)
The regional value is compared to the national value.
Prior Value
(19.0%)
Prior Value compares a measured value with the previously measured value. Confidence intervals were not taken into account in determining the direction of the comparison.
Trend
This comparison measures the indicator’s values over multiple time periods.<br>The Mann-Kendall Test for Statistical Significance is used to evaluate the trend<br>over 4 to 10 periods of measure, subject to data availability and comparability.
County: Hodgeman Cholesterol Test History
County: Hodgeman Cholesterol Test History
85.3%
(2021)
Compared to:
KS Counties
The distribution is based on data from 105 Kansas counties.
U.S. Counties
The distribution is based on data from 3,074 U.S. counties and county equivalents.
US Value
(86.4%)
The regional value is compared to the national value.
County: Hodgeman Congestive Heart Failure Hospital Admission Rate
County: Hodgeman Congestive Heart Failure Hospital Admission Rate
45.9
Per 10,000 population
(2018-2020)
Compared to:
KS Value
(24.1)
The regional value is compared to the Kansas State value.
Prior Value
(46.7)
Prior Value compares a measured value with the previously measured value. Confidence intervals were taken into account in determining the direction of the comparison.
County: Hodgeman Heart Disease Hospital Admission Rate
County: Hodgeman Heart Disease Hospital Admission Rate
155.9
Per 10,000 population
(2018-2020)
Compared to:
KS Value
(111.9)
The regional value is compared to the Kansas State value.
Prior Value
(173.7)
Prior Value compares a measured value with the previously measured value. Confidence intervals were taken into account in determining the direction of the comparison.
County: Hodgeman Heart Failure: Medicare Population
County: Hodgeman Heart Failure: Medicare Population
17.0%
(2022)
Compared to:
KS Counties
The distribution is based on data from 105 Kansas counties.
U.S. Counties
The distribution is based on data from 3,129 U.S. counties and county equivalents.
KS Value
(11.0%)
The regional value is compared to the Kansas State value.
US Value
(11.0%)
The regional value is compared to the national value.
Prior Value
(19.0%)
Prior Value compares a measured value with the previously measured value. Confidence intervals were not taken into account in determining the direction of the comparison.
Trend
This comparison measures the indicator’s values over multiple time periods.<br>The Mann-Kendall Test for Statistical Significance is used to evaluate the trend<br>over 4 to 10 periods of measure, subject to data availability and comparability.
County: Hodgeman High Blood Pressure Prevalence
County: Hodgeman High Blood Pressure Prevalence
36.9%
(2021)
Compared to:
KS Counties
The distribution is based on data from 105 Kansas counties.
U.S. Counties
The distribution is based on data from 3,074 U.S. counties and county equivalents.
US Value
(32.7%)
The regional value is compared to the national value.
HP 2030 Target
(41.9%)
County: Hodgeman High Cholesterol Prevalence: Past 5 Years
County: Hodgeman High Cholesterol Prevalence: Past 5 Years
40.5%
(2021)
Compared to:
KS Counties
The distribution is based on data from 105 Kansas counties.
U.S. Counties
The distribution is based on data from 3,074 U.S. counties and county equivalents.
US Value
(36.4%)
The regional value is compared to the national value.
County: Hodgeman Hyperlipidemia: Medicare Population
County: Hodgeman Hyperlipidemia: Medicare Population
56.0%
(2022)
Compared to:
KS Counties
The distribution is based on data from 105 Kansas counties.
U.S. Counties
The distribution is based on data from 3,129 U.S. counties and county equivalents.
KS Value
(63.0%)
The regional value is compared to the Kansas State value.
US Value
(65.0%)
The regional value is compared to the national value.
Prior Value
(57.0%)
Prior Value compares a measured value with the previously measured value. Confidence intervals were not taken into account in determining the direction of the comparison.
Trend
This comparison measures the indicator’s values over multiple time periods.<br>The Mann-Kendall Test for Statistical Significance is used to evaluate the trend<br>over 4 to 10 periods of measure, subject to data availability and comparability.
County: Hodgeman Hypertension: Medicare Population
County: Hodgeman Hypertension: Medicare Population
68.0%
(2022)
Compared to:
KS Counties
The distribution is based on data from 105 Kansas counties.
U.S. Counties
The distribution is based on data from 3,129 U.S. counties and county equivalents.
KS Value
(66.0%)
The regional value is compared to the Kansas State value.
US Value
(65.0%)
The regional value is compared to the national value.
Prior Value
(71.0%)
Prior Value compares a measured value with the previously measured value. Confidence intervals were not taken into account in determining the direction of the comparison.
Trend
This comparison measures the indicator’s values over multiple time periods.<br>The Mann-Kendall Test for Statistical Significance is used to evaluate the trend<br>over 4 to 10 periods of measure, subject to data availability and comparability.
County: Hodgeman Ischemic Heart Disease: Medicare Population
County: Hodgeman Ischemic Heart Disease: Medicare Population
19.0%
(2022)
Compared to:
KS Counties
The distribution is based on data from 105 Kansas counties.
U.S. Counties
The distribution is based on data from 3,129 U.S. counties and county equivalents.
KS Value
(21.0%)
The regional value is compared to the Kansas State value.
US Value
(21.0%)
The regional value is compared to the national value.
Prior Value
(22.0%)
Prior Value compares a measured value with the previously measured value. Confidence intervals were not taken into account in determining the direction of the comparison.
Trend
This comparison measures the indicator’s values over multiple time periods.<br>The Mann-Kendall Test for Statistical Significance is used to evaluate the trend<br>over 4 to 10 periods of measure, subject to data availability and comparability.
County: Hodgeman Stroke: Medicare Population
County: Hodgeman Stroke: Medicare Population
8.0%
(2022)
Compared to:
KS Counties
The distribution is based on data from 105 Kansas counties.
U.S. Counties
The distribution is based on data from 3,129 U.S. counties and county equivalents.
KS Value
(5.0%)
The regional value is compared to the Kansas State value.
US Value
(6.0%)
The regional value is compared to the national value.
Prior Value
(8.0%)
Prior Value compares a measured value with the previously measured value. Confidence intervals were not taken into account in determining the direction of the comparison.
Trend
This comparison measures the indicator’s values over multiple time periods.<br>The Mann-Kendall Test for Statistical Significance is used to evaluate the trend<br>over 4 to 10 periods of measure, subject to data availability and comparability.
County: Hodgeman
Health / Immunizations & Infectious Diseases
Value
Compared to:
County: Hodgeman COVID-19 Daily Average Case-Fatality Rate
County: Hodgeman COVID-19 Daily Average Case-Fatality Rate
0.0
Deaths per 100 cases
(Feb 24, 2023)
Compared to:
KS Counties
(Sep 30, 2022)
The distribution is based on data from 97 Kansas counties.
U.S. Counties
(Mar 25, 2022)
The distribution is based on data from 2,811 U.S. counties and county equivalents.
KS Value
(0.1)
The regional value is compared to the Kansas State value.
US Value
(1.4)
The regional value is compared to the national value.
Prior Value
(0.0)
Prior Value compares a measured value with the previously measured value. Confidence intervals were not taken into account in determining the direction of the comparison.
Trend
This comparison measures the indicator’s values over multiple time periods.<br>The Mann-Kendall Test for Statistical Significance is used to evaluate the trend<br>over 4 to 10 periods of measure, subject to data availability and comparability.
County: Hodgeman COVID-19 Daily Average Incidence Rate
County: Hodgeman COVID-19 Daily Average Incidence Rate
0.00
Cases per 100,000 population
(Mar 3, 2023)
Compared to:
KS Counties
The distribution is based on data from 105 Kansas counties.
U.S. Counties
The distribution is based on data from 3,142 U.S. counties and county equivalents.
KS Value
(11.10)
The regional value is compared to the Kansas State value.
US Value
(10.97)
The regional value is compared to the national value.
Prior Value
(8.51)
Prior Value compares a measured value with the previously measured value. Confidence intervals were not taken into account in determining the direction of the comparison.
Trend
This comparison measures the indicator’s values over multiple time periods.<br>The Mann-Kendall Test for Statistical Significance is used to evaluate the trend<br>over 4 to 10 periods of measure, subject to data availability and comparability.
County: Hodgeman Flu Vaccinations: Medicare Population
County: Hodgeman Flu Vaccinations: Medicare Population
9.0%
(2022)
Compared to:
KS Counties
The distribution is based on data from 105 Kansas counties.
U.S. Counties
The distribution is based on data from 3,129 U.S. counties and county equivalents.
KS Value
(50.0%)
The regional value is compared to the Kansas State value.
US Value
(50.0%)
The regional value is compared to the national value.
Prior Value
(42.0%)
Prior Value compares a measured value with the previously measured value. Confidence intervals were not taken into account in determining the direction of the comparison.
Trend
This comparison measures the indicator’s values over multiple time periods.<br>The Mann-Kendall Test for Statistical Significance is used to evaluate the trend<br>over 4 to 10 periods of measure, subject to data availability and comparability.
County: Hodgeman Percent of Infants Fully Immunized at 24 Months
County: Hodgeman Percent of Infants Fully Immunized at 24 Months
87.5%
(2017-2018)
Compared to:
KS Value
(71.1%)
The regional value is compared to the Kansas State value.
Prior Value
(88.0%)
Prior Value compares a measured value with the previously measured value. Confidence intervals were taken into account in determining the direction of the comparison.
County: Hodgeman Persons Fully Vaccinated Against COVID-19
County: Hodgeman Persons Fully Vaccinated Against COVID-19
47.2%
(May 10, 2023)
Compared to:
KS Counties
The distribution is based on data from 105 Kansas counties.
U.S. Counties
The distribution is based on data from 3,125 U.S. counties and county equivalents.
Prior Value
(47.2%)
Prior Value compares a measured value with the previously measured value. Confidence intervals were not taken into account in determining the direction of the comparison.
Trend
This comparison measures the indicator’s values over multiple time periods.<br>The Mann-Kendall Test for Statistical Significance is used to evaluate the trend<br>over 4 to 10 periods of measure, subject to data availability and comparability.
County: Hodgeman Pneumonia Vaccinations: Medicare Population
County: Hodgeman Pneumonia Vaccinations: Medicare Population
3.0%
(2022)
Compared to:

KS Counties
The distribution is based on data from 105 Kansas counties.
U.S. Counties
The distribution is based on data from 3,129 U.S. counties and county equivalents.
KS Value
(7.0%)
The regional value is compared to the Kansas State value.
US Value
(8.0%)
The regional value is compared to the national value.
Prior Value
(5.0%)
Prior Value compares a measured value with the previously measured value. Confidence intervals were not taken into account in determining the direction of the comparison.
Trend
This comparison measures the indicator’s values over multiple time periods.<br>The Mann-Kendall Test for Statistical Significance is used to evaluate the trend<br>over 4 to 10 periods of measure, subject to data availability and comparability.
County: Hodgeman
Health / Maternal, Fetal & Infant Health
Value
Compared to:
County: Hodgeman Infant Mortality Rate
County: Hodgeman Infant Mortality Rate
12.8
Deaths per 1,000 live births
(2017-2021)
Compared to:
KS Value
(5.9)
The regional value is compared to the Kansas State value.
US Value
(6.0 in 2011-2015)
The five-year U.S. rate is compared to the five-year Kansas rate. The U.S. rate may be based on one or more years of preliminary statistics. Five-year time period for this value is 2010-2014, final 2015 data not available at national level, at this time.
Prior Value
(0.0)
Prior Value compares a measured value with the previously measured value. Confidence intervals were taken into account in determining the direction of the comparison.
Trend
This comparison measures the indicator’s values over multiple time periods.<br>The Mann-Kendall Test for Statistical Significance is used to evaluate the trend<br>over 4 to 10 periods of measure, subject to data availability and comparability.
HP 2030 Target
(5.0)
County: Hodgeman Number of Births per 1,000 Population
County: Hodgeman Number of Births per 1,000 Population
8.9
Births per 1,000 population
(2019-2021)
Compared to:
KS Value
(11.9)
The regional value is compared to the Kansas State value.
US Value
(12.5 in 2013-2015)
The Kansas State value is compared to the U.S. value. Three-year time period for this comparison is 2013-2015, this is the most current US data at this time.
Prior Value
(9.3)
Prior Value compares a measured value with the previously measured value. Confidence intervals were taken into account in determining the direction of the comparison.
Trend
This comparison measures the indicator’s values over multiple time periods.<br>The Mann-Kendall Test for Statistical Significance is used to evaluate the trend<br>over 4 to 10 periods of measure, subject to data availability and comparability.
County: Hodgeman Percent of all Births Occurring to Teens (15-19)
County: Hodgeman Percent of all Births Occurring to Teens (15-19)
10.0%
(2002-2004)
Compared to:
KS Value
(10.1%)
Births with unknown values are excluded from the denominator for this calculation. The county and regional values are compared to the Kansas state value. Confidence intervals were not taken into account while making this comparision.
US Value
(18.8% in 2015-2017)
The regional value is compared to the most current single year national value.
Prior Value
(12.9%)
Prior Value compares a measured value with the previously measured value. Confidence intervals were taken into account in determining the direction of the comparison.
County: Hodgeman Percent of Births Occurring to Unmarried Women
County: Hodgeman Percent of Births Occurring to Unmarried Women
19.1%
(2019-2021)
Compared to:
KS Value
(36.4%)
The regional value is compared to the Kansas State value.
US Value
(39.8% in 2015-2017)
The regional value is compared to the most current single year national value.
Prior Value
(12.0%)
Prior Value compares a measured value with the previously measured value. Confidence intervals were taken into account in determining the direction of the comparison.
Trend
This comparison measures the indicator’s values over multiple time periods.<br>The Mann-Kendall Test for Statistical Significance is used to evaluate the trend<br>over 4 to 10 periods of measure, subject to data availability and comparability.
County: Hodgeman Percent of births Where Mother Smoked During Pregnancy
County: Hodgeman Percent of births Where Mother Smoked During Pregnancy
9.5%
(2012-2014)
Compared to:
KS Value
(12.7%)
The County / Region value is compared to the Kansas State Value. Total live births excludes births for which the gestational length of the baby was unknown. The trend is a comparison between the most recent and previous measurement periods. Confidence intervals were not taken into account in determining the direction of the trend.
US Value
(6.9% in 2015-2017)
The regional value is compared to the most current single year national value.
Prior Value
(13.0%)
Prior Value compares a measured value with the previously measured value. Confidence intervals were taken into account in determining the direction of the comparison.
Trend
This comparison measures the indicator’s values over multiple time periods.<br>The Mann-Kendall Test for Statistical Significance is used to evaluate the trend<br>over 4 to 10 periods of measure, subject to data availability and comparability.
County: Hodgeman Percent of Births Where Prenatal Care began in First Trimester
County: Hodgeman Percent of Births Where Prenatal Care began in First Trimester
84.8%
(2019-2021)
Compared to:
KS Value
(81.3%)
The regional value is compared to the Kansas State value.
US Value
(77.3% in 2015-2017)
The regional value is compared to the most current single year national value.
Prior Value
(73.5%)
Prior Value compares a measured value with the previously measured value. Confidence intervals were taken into account in determining the direction of the comparison.
Trend
This comparison measures the indicator’s values over multiple time periods.<br>The Mann-Kendall Test for Statistical Significance is used to evaluate the trend<br>over 4 to 10 periods of measure, subject to data availability and comparability.
HP 2030 Target
(80.5%)
County: Hodgeman Percent of Births with Inadequate Birth Spacing
County: Hodgeman Percent of Births with Inadequate Birth Spacing
26.7%
(2019-2021)
Compared to:
KS Value
(10.2%)
The regional value is compared to the Kansas State value.
US Value
(11.8% in 2015-2017)
The regional value is compared to the most current single year national value.
Prior Value
(17.6%)
Prior Value compares a measured value with the previously measured value. Confidence intervals were taken into account in determining the direction of the comparison.
Trend
This comparison measures the indicator’s values over multiple time periods.<br>The Mann-Kendall Test for Statistical Significance is used to evaluate the trend<br>over 4 to 10 periods of measure, subject to data availability and comparability.
County: Hodgeman Percent of Births with Low Birth Weight
County: Hodgeman Percent of Births with Low Birth Weight
10.6%
(2019-2021)
Compared to:
KS Value
(7.4%)
The regional value is compared to the Kansas State value.
US Value
(8.3% in 2015-2017)
The regional value is compared to the most current single year national value.
Prior Value
(9.5%)
Prior Value compares a measured value with the previously measured value. Confidence intervals were taken into account in determining the direction of the comparison.
Trend
This comparison measures the indicator’s values over multiple time periods.<br>The Mann-Kendall Test for Statistical Significance is used to evaluate the trend<br>over 4 to 10 periods of measure, subject to data availability and comparability.
County: Hodgeman Percent of WIC Mothers Breastfeeding Exclusively
County: Hodgeman Percent of WIC Mothers Breastfeeding Exclusively
0.0%
(2023)
Compared to:
KS Value
(18.2%)
The regional value is compared to the Kansas State value.
Prior Value
(2.3%)
Prior Value compares a measured value with the previously measured value. Confidence intervals were not taken into account in determining the direction of the comparison.
County: Hodgeman Percentage of Premature Births
County: Hodgeman Percentage of Premature Births
10.6%
(2019-2021)
Compared to:
KS Value
(10.0%)
The regional value is compared to the Kansas State value.
US Value
(9.9% in 2015-2017)
The regional value is compared to the most current single year national value.
Prior Value
(16.0%)
Prior Value compares a measured value with the previously measured value. Confidence intervals were taken into account in determining the direction of the comparison.
Trend
This comparison measures the indicator’s values over multiple time periods.<br>The Mann-Kendall Test for Statistical Significance is used to evaluate the trend<br>over 4 to 10 periods of measure, subject to data availability and comparability.
HP 2030 Target
(9.4%)
County: Hodgeman
Health / Medications & Prescriptions
Value
Compared to:
County: Hodgeman Poisoning (Drugs) Hospital Admission Rate
County: Hodgeman Poisoning (Drugs) Hospital Admission Rate
0.0
Per 10,000 population
(2016-2018)
Compared to:
KS Value
(1.1)
The regional value is compared to the Kansas State value.
County: Hodgeman
Health / Mental Health & Mental Disorders
Value
Compared to:
County: Hodgeman Adults Ever Diagnosed with Depression
County: Hodgeman Adults Ever Diagnosed with Depression
18.5%
(2021)
Compared to:
KS Counties
The distribution is based on data from 105 Kansas counties.
U.S. Counties
The distribution is based on data from 3,074 U.S. counties and county equivalents.
US Value
(19.5%)
The regional value is compared to the national value.
County: Hodgeman Depression: Medicare Population
County: Hodgeman Depression: Medicare Population
14.0%
(2022)
Compared to:
KS Counties
The distribution is based on data from 105 Kansas counties.
U.S. Counties
The distribution is based on data from 3,129 U.S. counties and county equivalents.
KS Value
(18.0%)
The regional value is compared to the Kansas State value.
US Value
(16.0%)
The regional value is compared to the national value.
Prior Value
(16.0%)
Prior Value compares a measured value with the previously measured value. Confidence intervals were not taken into account in determining the direction of the comparison.
Trend
This comparison measures the indicator’s values over multiple time periods.<br>The Mann-Kendall Test for Statistical Significance is used to evaluate the trend<br>over 4 to 10 periods of measure, subject to data availability and comparability.
County: Hodgeman Frequent Mental Distress
County: Hodgeman Frequent Mental Distress
13.6%
(2019)
Compared to:
KS Counties
The distribution is based on data from 105 Kansas counties.
U.S. Counties
The distribution is based on data from 3,121 U.S. counties and county equivalents.
KS Value
(14.4%)
The regional value is compared to the Kansas State value.
US Value
(14.0%)
The regional value is compared to the national value.
Prior Value
(13.2%)
Prior Value compares a measured value with the previously measured value. Confidence intervals were taken into account in determining the direction of the comparison.
County: Hodgeman Mental Behavior Hospital Admissions Rate
County: Hodgeman Mental Behavior Hospital Admissions Rate
35.4
Per 10,000 population
(2018-2020)
Compared to:
KS Value
(70.6)
The regional value is compared to the Kansas State value.
Prior Value
(30.1)
Prior Value compares a measured value with the previously measured value. Confidence intervals were taken into account in determining the direction of the comparison.
County: Hodgeman Poor Mental Health: 14+ Days
County: Hodgeman Poor Mental Health: 14+ Days
13.4%
(2021)
Compared to:
KS Counties
The distribution is based on data from 105 Kansas counties.
U.S. Counties
The distribution is based on data from 3,074 U.S. counties and county equivalents.
US Value
(14.7%)
The regional value is compared to the national value.
County: Hodgeman
Health / Mortality Data
Value
Compared to:
0.0
Deaths per 100,000 population
(2018-2020)
Compared to:
KS Value
(23.3)
The regional value is compared to the Kansas State value.
US Value
(29.4 in 2014-2016)
The Kansas State value is compared to the U.S. value. U.S. comparison value is taken from the most recent single year (2015) NCHS preliminary data report.
Prior Value
(0.0)
Prior Value compares a measured value with the previously measured value. Confidence intervals were taken into account in determining the direction of the comparison.
Trend
This comparison measures the indicator’s values over multiple time periods.<br>The Mann-Kendall Test for Statistical Significance is used to evaluate the trend<br>over 4 to 10 periods of measure, subject to data availability and comparability.
County: Hodgeman Age-adjusted Cancer Mortality Rate per 100,000 population
County: Hodgeman Age-adjusted Cancer Mortality Rate per 100,000 population
152.8
Deaths per 100,000 population
(2018-2020)
Compared to:
KS Value
(151.4)
The regional value is compared to the Kansas State value.
US Value
(158.5 in 2014-2016)
The Kansas State value is compared to the U.S. value. U.S. comparison value is taken from the most recent single year (2015) NCHS preliminary data report.
Prior Value
(168.5)
Prior Value compares a measured value with the previously measured value. Confidence intervals were taken into account in determining the direction of the comparison.
Trend
This comparison measures the indicator’s values over multiple time periods.<br>The Mann-Kendall Test for Statistical Significance is used to evaluate the trend<br>over 4 to 10 periods of measure, subject to data availability and comparability.
HP 2030 Target
(122.7)
0.0
Deaths per 100,000 population
(2018-2020)
Compared to:
KS Value
(35.2)
The regional value is compared to the Kansas State value.
US Value
(37.6 in 2014-2016)
The Kansas State value is compared to the U.S. value. U.S. comparison value is taken from the most recent single year (2015) NCHS preliminary data report.
Prior Value
(64.08)
Prior Value compares a measured value with the previously measured value. Confidence intervals were taken into account in determining the direction of the comparison.
Trend
This comparison measures the indicator’s values over multiple time periods.<br>The Mann-Kendall Test for Statistical Significance is used to evaluate the trend<br>over 4 to 10 periods of measure, subject to data availability and comparability.
HP 2030 Target
(33.4)
0.0
Deaths per 100,000 population
(2018-2020)
Compared to:
KS Value
(47.1)
The regional value is compared to the Kansas State value.
US Value
(41.6 in 2014-2016)
The Kansas State value is compared to the U.S. value. U.S. comparison value is taken from the most recent single year (2015) NCHS preliminary data report.
Prior Value
(56.8)
Prior Value compares a measured value with the previously measured value. Confidence intervals were taken into account in determining the direction of the comparison.
County: Hodgeman Age-adjusted Diabetes Mortality Rate per 100,000 population
County: Hodgeman Age-adjusted Diabetes Mortality Rate per 100,000 population
0.0
Deaths per 100,000 population
(2018-2020)
Compared to:
KS Value
(25.0)
The regional value is compared to the Kansas State value.
US Value
(21.5 in 2015-2017)
The Kansas State value is compared to the U.S. value. U.S. comparison value is taken from the most recent single year (2017) NCHS preliminary data report.
Prior Value
(0.0)
Prior Value compares a measured value with the previously measured value. Confidence intervals were taken into account in determining the direction of the comparison.
County: Hodgeman Age-adjusted Heart Disease Mortality Rate per 100,000 population
County: Hodgeman Age-adjusted Heart Disease Mortality Rate per 100,000 population
209.2
Deaths per 100,000 population
(2018-2020)
Compared to:
KS Value
(162.0)
The regional value is compared to the Kansas State value.
US Value
(168.5 in 2014-2016)
The Kansas State value is compared to the U.S. value. U.S. comparison value is taken from the most recent single year (2015) NCHS preliminary data report.
Prior Value
(198.3)
Prior Value compares a measured value with the previously measured value. Confidence intervals were taken into account in determining the direction of the comparison.
Trend
This comparison measures the indicator’s values over multiple time periods.<br>The Mann-Kendall Test for Statistical Significance is used to evaluate the trend<br>over 4 to 10 periods of measure, subject to data availability and comparability.
County: Hodgeman Age-adjusted Homicide Mortality Rate per 100,000 population
County: Hodgeman Age-adjusted Homicide Mortality Rate per 100,000 population
0.0
Deaths per 100,000 population
(2018-2020)
Compared to:
KS Value
(5.9)
The regional value is compared to the Kansas State value.
US Value
(5.7 in 2014-2016)
The Kansas State value is compared to the U.S. value. U.S. comparison value is taken from the most recent single year (2015) NCHS preliminary data report.
Prior Value
(0.0)
Prior Value compares a measured value with the previously measured value. Confidence intervals were taken into account in determining the direction of the comparison.
Trend
This comparison measures the indicator’s values over multiple time periods.<br>The Mann-Kendall Test for Statistical Significance is used to evaluate the trend<br>over 4 to 10 periods of measure, subject to data availability and comparability.
HP 2030 Target
(5.5)
County: Hodgeman Age-adjusted Mortality Rate per 100,000 population
County: Hodgeman Age-adjusted Mortality Rate per 100,000 population
842.0
Deaths per 100,000 population
(2018-2020)
Compared to:
KS Value
(795.9)
The regional value is compared to the Kansas State value.
US Value
(731.9 in 2015-2017)
The Kansas State value is compared to the U.S. value. U.S. comparison value is taken from the most recent single year (2017) NCHS preliminary data report.
Prior Value
(861.5)
Prior Value compares a measured value with the previously measured value. Confidence intervals were taken into account in determining the direction of the comparison.
Trend
This comparison measures the indicator’s values over multiple time periods.<br>The Mann-Kendall Test for Statistical Significance is used to evaluate the trend<br>over 4 to 10 periods of measure, subject to data availability and comparability.
0.0
Deaths per 100,000 population
(2018-2020)
Compared to:
KS Value
(14.8)
The regional value is compared to the Kansas State value.
US Value
(13.0 in 2015-2017)
The Kansas State value is compared to the U.S. value. U.S. comparison value is taken from the most recent single year (2017) NCHS preliminary data report.
Prior Value
(0.0)
Prior Value compares a measured value with the previously measured value. Confidence intervals were taken into account in determining the direction of the comparison.
Trend
This comparison measures the indicator’s values over multiple time periods.<br>The Mann-Kendall Test for Statistical Significance is used to evaluate the trend<br>over 4 to 10 periods of measure, subject to data availability and comparability.
County: Hodgeman Age-adjusted Suicide Mortality Rate per 100,000 population
County: Hodgeman Age-adjusted Suicide Mortality Rate per 100,000 population
0.0
Deaths per 100,000 population
(2018-2020)
Compared to:
KS Value
(18.5)
The regional value is compared to the Kansas State value.
US Value
(13.3 in 2014-2016)
The Kansas State value is compared to the U.S. value. U.S. comparison value is taken from the most recent single year (2015) NCHS preliminary data report.
Prior Value
(0.0)
Prior Value compares a measured value with the previously measured value. Confidence intervals were taken into account in determining the direction of the comparison.
Trend
This comparison measures the indicator’s values over multiple time periods.<br>The Mann-Kendall Test for Statistical Significance is used to evaluate the trend<br>over 4 to 10 periods of measure, subject to data availability and comparability.
HP 2030 Target
(12.8)
County: Hodgeman Age-adjusted Traffic Injury Mortality Rate per 100,000 population
County: Hodgeman Age-adjusted Traffic Injury Mortality Rate per 100,000 population
0.0
Deaths per 100,000 population
(2018-2020)
Compared to:
KS Value
(13.6)
The regional value is compared to the Kansas State value.
US Value
(11.4 in 2014-2016)
The Kansas State value is compared to the U.S. value. U.S. comparison value is taken from the most recent single year (2015) NCHS preliminary data report.
HP 2030 Target
(10.1)
0.0
Deaths per 100,000 population
(2018-2020)
Compared to:
KS Value
(48.7)
The regional value is compared to the Kansas State value.
US Value
(49.5 in 2015-2017)
The Kansas State value is compared to the U.S. value. U.S. comparison value is taken from the most recent single year (2017) NCHS preliminary data report.
Prior Value
(137.5)
Prior Value compares a measured value with the previously measured value. Confidence intervals were taken into account in determining the direction of the comparison.
Trend
This comparison measures the indicator’s values over multiple time periods.<br>The Mann-Kendall Test for Statistical Significance is used to evaluate the trend<br>over 4 to 10 periods of measure, subject to data availability and comparability.
HP 2030 Target
(43.2)
County: Hodgeman Age-Adjusted Years of Potential Life Lost - Alzheimers
County: Hodgeman Age-Adjusted Years of Potential Life Lost - Alzheimers
0.0
Years per 100,000 Population
(2018-2020)
Compared to:
KS Value
(11.0)
The regional value is compared to the Kansas State value.
Prior Value
(0.0)
Prior Value compares a measured value with the previously measured value. Confidence intervals were taken into account in determining the direction of the comparison.
Trend
This comparison measures the indicator’s values over multiple time periods.<br>The Mann-Kendall Test for Statistical Significance is used to evaluate the trend<br>over 4 to 10 periods of measure, subject to data availability and comparability.
County: Hodgeman Age-Adjusted Years of Potential Life Lost - Cancer
County: Hodgeman Age-Adjusted Years of Potential Life Lost - Cancer
857.7
Years per 100,000 Population
(2018-2020)
Compared to:
KS Value
(1,176.7)
The regional value is compared to the Kansas State value.
Prior Value
(1,046.9)
Prior Value compares a measured value with the previously measured value. Confidence intervals were taken into account in determining the direction of the comparison.
Trend
This comparison measures the indicator’s values over multiple time periods.<br>The Mann-Kendall Test for Statistical Significance is used to evaluate the trend<br>over 4 to 10 periods of measure, subject to data availability and comparability.
County: Hodgeman Age-Adjusted Years of Potential Life Lost - Cerebrovascular Disease
County: Hodgeman Age-Adjusted Years of Potential Life Lost - Cerebrovascular Disease
0.0
Years per 100,000 Population
(2018-2020)
Compared to:
KS Value
(149.9)
The regional value is compared to the Kansas State value.
Prior Value
(0.0)
Prior Value compares a measured value with the previously measured value. Confidence intervals were taken into account in determining the direction of the comparison.
Trend
This comparison measures the indicator’s values over multiple time periods.<br>The Mann-Kendall Test for Statistical Significance is used to evaluate the trend<br>over 4 to 10 periods of measure, subject to data availability and comparability.
0.0
Years per 100,000 Population
(2018-2020)
Compared to:
KS Value
(199.2)
The regional value is compared to the Kansas State value.
Prior Value
(0.0)
Prior Value compares a measured value with the previously measured value. Confidence intervals were taken into account in determining the direction of the comparison.
Trend
This comparison measures the indicator’s values over multiple time periods.<br>The Mann-Kendall Test for Statistical Significance is used to evaluate the trend<br>over 4 to 10 periods of measure, subject to data availability and comparability.
County: Hodgeman Age-Adjusted Years of Potential Life Lost - Diabetes
County: Hodgeman Age-Adjusted Years of Potential Life Lost - Diabetes
0.0
Years per 100,000 Population
(2018-2020)
Compared to:
KS Value
(201.3)
The regional value is compared to the Kansas State value.
Prior Value
(0.0)
Prior Value compares a measured value with the previously measured value. Confidence intervals were taken into account in determining the direction of the comparison.
Trend
This comparison measures the indicator’s values over multiple time periods.<br>The Mann-Kendall Test for Statistical Significance is used to evaluate the trend<br>over 4 to 10 periods of measure, subject to data availability and comparability.
County: Hodgeman Age-Adjusted Years of Potential Life Lost - Heart Disease
County: Hodgeman Age-Adjusted Years of Potential Life Lost - Heart Disease
0.0
Years per 100,000 Population
(2018-2020)
Compared to:
KS Value
(899.4)
The regional value is compared to the Kansas State value.
Prior Value
(716.7)
Prior Value compares a measured value with the previously measured value. Confidence intervals were taken into account in determining the direction of the comparison.
Trend
This comparison measures the indicator’s values over multiple time periods.<br>The Mann-Kendall Test for Statistical Significance is used to evaluate the trend<br>over 4 to 10 periods of measure, subject to data availability and comparability.
County: Hodgeman Age-Adjusted Years of Potential Life Lost - Homicide
County: Hodgeman Age-Adjusted Years of Potential Life Lost - Homicide
0.0
Years per 100,000 Population
(2018-2020)
Compared to:
KS Value
(264.9)
The regional value is compared to the Kansas State value.
Prior Value
(0.0)
Prior Value compares a measured value with the previously measured value. Confidence intervals were taken into account in determining the direction of the comparison.
Trend
This comparison measures the indicator’s values over multiple time periods.<br>The Mann-Kendall Test for Statistical Significance is used to evaluate the trend<br>over 4 to 10 periods of measure, subject to data availability and comparability.
0.0
Years per 100,000 Population
(2018-2020)
Compared to:
KS Value
(79.2)
The regional value is compared to the Kansas State value.
Prior Value
(0.0)
Prior Value compares a measured value with the previously measured value. Confidence intervals were taken into account in determining the direction of the comparison.
Trend
This comparison measures the indicator’s values over multiple time periods.<br>The Mann-Kendall Test for Statistical Significance is used to evaluate the trend<br>over 4 to 10 periods of measure, subject to data availability and comparability.
County: Hodgeman Age-Adjusted Years of Potential Life Lost - Suicide
County: Hodgeman Age-Adjusted Years of Potential Life Lost - Suicide
0.0
Years per 100,000 Population
(2018-2020)
Compared to:
KS Value
(673.8)
The regional value is compared to the Kansas State value.
Prior Value
(0.0)
Prior Value compares a measured value with the previously measured value. Confidence intervals were taken into account in determining the direction of the comparison.
Trend
This comparison measures the indicator’s values over multiple time periods.<br>The Mann-Kendall Test for Statistical Significance is used to evaluate the trend<br>over 4 to 10 periods of measure, subject to data availability and comparability.
County: Hodgeman Age-Adjusted Years of Potential Life Lost - Traffic Injury
County: Hodgeman Age-Adjusted Years of Potential Life Lost - Traffic Injury
0.0
Years per 100,000 Population
(2018-2020)
Compared to:
KS Value
(460.5)
The regional value is compared to the Kansas State value.
Prior Value
(0.0)
Prior Value compares a measured value with the previously measured value. Confidence intervals were taken into account in determining the direction of the comparison.
Trend
This comparison measures the indicator’s values over multiple time periods.<br>The Mann-Kendall Test for Statistical Significance is used to evaluate the trend<br>over 4 to 10 periods of measure, subject to data availability and comparability.
County: Hodgeman Age-Adjusted Years of Potential Life Lost - Unintentional Injuries
County: Hodgeman Age-Adjusted Years of Potential Life Lost - Unintentional Injuries
0.0
Years per 100,000 Population
(2018-2020)
Compared to:
KS Value
(1,198.7)
The regional value is compared to the Kansas State value.
Prior Value
(0.0)
Prior Value compares a measured value with the previously measured value. Confidence intervals were taken into account in determining the direction of the comparison.
Trend
This comparison measures the indicator’s values over multiple time periods.<br>The Mann-Kendall Test for Statistical Significance is used to evaluate the trend<br>over 4 to 10 periods of measure, subject to data availability and comparability.
County: Hodgeman Life Expectancy
County: Hodgeman Life Expectancy
70.8
Years
(2019-2021)
Compared to:
KS Counties
The distribution is based on data from 102 Kansas counties.
U.S. Counties
The distribution is based on data from 3,070 U.S. counties and county equivalents.
KS Value
(77.0)
The regional value is compared to the Kansas State value.
US Value
(77.6)
The regional value is compared to the national value.
County: Hodgeman
Health / Older Adults
Value
Compared to:
County: Hodgeman Adult Day Care Spending-to-Income Ratio
County: Hodgeman Adult Day Care Spending-to-Income Ratio
8.8%
(2023)
Compared to:
KS Counties
The distribution is based on data from 105 Kansas counties.
U.S. Counties
The distribution is based on data from 3,141 U.S. counties and county equivalents.
KS Value
(11.9%)
The regional value is compared to the Kansas State value.
Prior Value
(9.2%)
Prior Value compares a measured value with the previously measured value. Confidence intervals were not taken into account in determining the direction of the comparison.
County: Hodgeman Adults 65+ who Received Recommended Preventive Services: Females
County: Hodgeman Adults 65+ who Received Recommended Preventive Services: Females
36.7%
(2020)
Compared to:
KS Counties
The distribution is based on data from 105 Kansas counties.
U.S. Counties
The distribution is based on data from 3,141 U.S. counties and county equivalents.
US Value
(37.9%)
The regional value is compared to the national value.
County: Hodgeman Adults 65+ who Received Recommended Preventive Services: Males
County: Hodgeman Adults 65+ who Received Recommended Preventive Services: Males
43.6%
(2020)
Compared to:
KS Counties
The distribution is based on data from 105 Kansas counties.
U.S. Counties
The distribution is based on data from 3,141 U.S. counties and county equivalents.
US Value
(43.7%)
The regional value is compared to the national value.
County: Hodgeman Adults 65+ with a Disability
County: Hodgeman Adults 65+ with a Disability
29.5%
(2018-2022)
Compared to:
KS Value
(33.6%)
The regional value is compared to the Kansas State value.
US Value
(33.3%)
The regional value is compared to the national value.
Trend
This comparison measures the indicator’s values over multiple time periods.<br>The Mann-Kendall Test for Statistical Significance is used to evaluate the trend<br>over 4 to 10 periods of measure, subject to data availability and comparability.
County: Hodgeman Adults 65+ with a Hearing Difficulty
County: Hodgeman Adults 65+ with a Hearing Difficulty
19.1%
(2018-2022)
Compared to:
KS Value
(15.5%)
The regional value is compared to the Kansas State value.
US Value
(13.7%)
The regional value is compared to the national value.
Trend
This comparison measures the indicator’s values over multiple time periods.<br>The Mann-Kendall Test for Statistical Significance is used to evaluate the trend<br>over 4 to 10 periods of measure, subject to data availability and comparability.
County: Hodgeman Adults 65+ with a Self-Care Difficulty
County: Hodgeman Adults 65+ with a Self-Care Difficulty
5.5%
(2018-2022)
Compared to:
KS Value
(5.9%)
The regional value is compared to the Kansas State value.
US Value
(7.4%)
The regional value is compared to the national value.
Trend
This comparison measures the indicator’s values over multiple time periods.<br>The Mann-Kendall Test for Statistical Significance is used to evaluate the trend<br>over 4 to 10 periods of measure, subject to data availability and comparability.
County: Hodgeman Adults 65+ with a Vision Difficulty
County: Hodgeman Adults 65+ with a Vision Difficulty
7.3%
(2018-2022)
Compared to:
KS Value
(5.8%)
The regional value is compared to the Kansas State value.
US Value
(6.0%)
The regional value is compared to the national value.
Trend
This comparison measures the indicator’s values over multiple time periods.<br>The Mann-Kendall Test for Statistical Significance is used to evaluate the trend<br>over 4 to 10 periods of measure, subject to data availability and comparability.
County: Hodgeman Adults 65+ with an Independent Living Difficulty
County: Hodgeman Adults 65+ with an Independent Living Difficulty
7.8%
(2018-2022)
Compared to:
KS Value
(11.7%)
The regional value is compared to the Kansas State value.
US Value
(13.6%)
The regional value is compared to the national value.
Trend
This comparison measures the indicator’s values over multiple time periods.<br>The Mann-Kendall Test for Statistical Significance is used to evaluate the trend<br>over 4 to 10 periods of measure, subject to data availability and comparability.
County: Hodgeman Alzheimer's Disease or Dementia: Medicare Population
County: Hodgeman Alzheimer's Disease or Dementia: Medicare Population
6.0%
(2022)
Compared to:
KS Counties
The distribution is based on data from 105 Kansas counties.
U.S. Counties
The distribution is based on data from 3,129 U.S. counties and county equivalents.
KS Value
(6.0%)
The regional value is compared to the Kansas State value.
US Value
(6.0%)
The regional value is compared to the national value.
Prior Value
(8.0%)
Prior Value compares a measured value with the previously measured value. Confidence intervals were not taken into account in determining the direction of the comparison.
Trend
This comparison measures the indicator’s values over multiple time periods.<br>The Mann-Kendall Test for Statistical Significance is used to evaluate the trend<br>over 4 to 10 periods of measure, subject to data availability and comparability.
County: Hodgeman
Health / Oral Health
Value
Compared to:
County: Hodgeman Adults 65+ with Total Tooth Loss
County: Hodgeman Adults 65+ with Total Tooth Loss
9.6%
(2020)
Compared to:
KS Counties
The distribution is based on data from 105 Kansas counties.
U.S. Counties
The distribution is based on data from 3,141 U.S. counties and county equivalents.
US Value
(13.4%)
The regional value is compared to the national value.
County: Hodgeman Adults who Visited a Dentist
County: Hodgeman Adults who Visited a Dentist
65.4%
(2020)
Compared to:
KS Counties
The distribution is based on data from 105 Kansas counties.
U.S. Counties
The distribution is based on data from 3,141 U.S. counties and county equivalents.
US Value
(64.8%)
The regional value is compared to the national value.
County: Hodgeman Dentist Rate
County: Hodgeman Dentist Rate
0
Dentists per 100,000 population
(2022)
Compared to:
KS Counties
The distribution is based on data from 101 Kansas counties.
U.S. Counties
The distribution is based on data from 3,054 U.S. counties and county equivalents.
KS Value
(63)
The regional value is compared to the Kansas State value.
Prior Value
Prior Value compares a measured value with the previously measured value. Confidence intervals were not taken into account in determining the direction of the comparison.
Trend
This comparison measures the indicator’s values over multiple time periods.<br>The Mann-Kendall Test for Statistical Significance is used to evaluate the trend<br>over 4 to 10 periods of measure, subject to data availability and comparability.
County: Hodgeman Percentage of Screened 3-12 Grade Students w No Dental Sealants
County: Hodgeman Percentage of Screened 3-12 Grade Students w No Dental Sealants
87.2%
(2022-2023)
Compared to:
KS Value
(61.3%)
The regional value is compared to the Kansas State value.
Prior Value
(83.4%)
Prior Value compares a measured value with the previously measured value. Confidence intervals were not taken into account in determining the direction of the comparison.
Trend
This comparison measures the indicator’s values over multiple time periods.<br>The Mann-Kendall Test for Statistical Significance is used to evaluate the trend<br>over 4 to 10 periods of measure, subject to data availability and comparability.
County: Hodgeman Percentage of Screened K-12 Grade Students w Obvious Dental Decay
County: Hodgeman Percentage of Screened K-12 Grade Students w Obvious Dental Decay
4.7%
(2022-2023)
Compared to:
KS Value
(13.8%)
The regional value is compared to the Kansas State value.
Prior Value
(9.8%)
Prior Value compares a measured value with the previously measured value. Confidence intervals were not taken into account in determining the direction of the comparison.
Trend
This comparison measures the indicator’s values over multiple time periods.<br>The Mann-Kendall Test for Statistical Significance is used to evaluate the trend<br>over 4 to 10 periods of measure, subject to data availability and comparability.
County: Hodgeman
Health / Other Conditions
Value
Compared to:
County: Hodgeman Adults with Arthritis
County: Hodgeman Adults with Arthritis
29.8%
(2021)
Compared to:
KS Counties
The distribution is based on data from 105 Kansas counties.
U.S. Counties
The distribution is based on data from 3,074 U.S. counties and county equivalents.
US Value
(25.2%)
The regional value is compared to the national value.
County: Hodgeman Adults with Kidney Disease
County: Hodgeman Adults with Kidney Disease
3.4%
(2021)
Compared to:
KS Counties
The distribution is based on data from 105 Kansas counties.
U.S. Counties
The distribution is based on data from 3,074 U.S. counties and county equivalents.
US Value
(3.1%)
The regional value is compared to the national value.
County: Hodgeman Chronic Kidney Disease: Medicare Population
County: Hodgeman Chronic Kidney Disease: Medicare Population
21.0%
(2022)
Compared to:
KS Counties
The distribution is based on data from 105 Kansas counties.
U.S. Counties
The distribution is based on data from 3,129 U.S. counties and county equivalents.
KS Value
(17.0%)
The regional value is compared to the Kansas State value.
US Value
(18.0%)
The regional value is compared to the national value.
Prior Value
(23.0%)
Prior Value compares a measured value with the previously measured value. Confidence intervals were not taken into account in determining the direction of the comparison.
Trend
This comparison measures the indicator’s values over multiple time periods.<br>The Mann-Kendall Test for Statistical Significance is used to evaluate the trend<br>over 4 to 10 periods of measure, subject to data availability and comparability.
County: Hodgeman Osteoporosis: Medicare Population
County: Hodgeman Osteoporosis: Medicare Population
15.0%
(2022)
Compared to:
KS Counties
The distribution is based on data from 105 Kansas counties.
U.S. Counties
The distribution is based on data from 3,129 U.S. counties and county equivalents.
KS Value
(11.0%)
The regional value is compared to the Kansas State value.
US Value
(11.0%)
The regional value is compared to the national value.
Prior Value
(17.0%)
Prior Value compares a measured value with the previously measured value. Confidence intervals were not taken into account in determining the direction of the comparison.
Trend
This comparison measures the indicator’s values over multiple time periods.<br>The Mann-Kendall Test for Statistical Significance is used to evaluate the trend<br>over 4 to 10 periods of measure, subject to data availability and comparability.
County: Hodgeman Rheumatoid Arthritis or Osteoarthritis: Medicare Population
County: Hodgeman Rheumatoid Arthritis or Osteoarthritis: Medicare Population
40.0%
(2022)
Compared to:
KS Counties
The distribution is based on data from 105 Kansas counties.
U.S. Counties
The distribution is based on data from 3,129 U.S. counties and county equivalents.
KS Value
(34.0%)
The regional value is compared to the Kansas State value.
US Value
(35.0%)
The regional value is compared to the national value.
Prior Value
(43.0%)
Prior Value compares a measured value with the previously measured value. Confidence intervals were not taken into account in determining the direction of the comparison.
Trend
This comparison measures the indicator’s values over multiple time periods.<br>The Mann-Kendall Test for Statistical Significance is used to evaluate the trend<br>over 4 to 10 periods of measure, subject to data availability and comparability.
County: Hodgeman
Health / Physical Activity
Value
Compared to:
County: Hodgeman Adults 20+ who are Sedentary
County: Hodgeman Adults 20+ who are Sedentary
14.9%
(2021)
Compared to:
KS Counties
The distribution is based on data from 105 Kansas counties.
U.S. Counties
The distribution is based on data from 3,074 U.S. counties and county equivalents.
Prior Value
(15.0%)
Prior Value compares a measured value with the previously measured value. Confidence intervals were taken into account in determining the direction of the comparison.
Trend
This comparison measures the indicator’s values over multiple time periods.<br>The Mann-Kendall Test for Statistical Significance is used to evaluate the trend<br>over 4 to 10 periods of measure, subject to data availability and comparability.
County: Hodgeman
Health / Prevention & Safety
Value
Compared to:
County: Hodgeman Injury Hospital Admission Rate
County: Hodgeman Injury Hospital Admission Rate
107.7
Per 10,000 population
(2018-2020)
Compared to:
KS Value
(72.0)
The regional value is compared to the Kansas State value.
Prior Value
(106.9)
Prior Value compares a measured value with the previously measured value. Confidence intervals were taken into account in determining the direction of the comparison.
County: Hodgeman
Health / Respiratory Diseases
Value
Compared to:
County: Hodgeman Adults with COPD
County: Hodgeman Adults with COPD
7.4%
Percent of adults
(2021)
Compared to:
KS Counties
The distribution is based on data from 105 Kansas counties.
U.S. Counties
The distribution is based on data from 3,074 U.S. counties and county equivalents.
US Value
(6.4%)
The regional value is compared to the national value.
County: Hodgeman Adults with Current Asthma
County: Hodgeman Adults with Current Asthma
9.5%
(2021)
Compared to:
KS Counties
The distribution is based on data from 105 Kansas counties.
U.S. Counties
The distribution is based on data from 3,074 U.S. counties and county equivalents.
US Value
(9.7%)
The regional value is compared to the national value.
County: Hodgeman Asthma Hospital Admission Rate
County: Hodgeman Asthma Hospital Admission Rate
13.0
Per 10,000 population
(2016-2018)
Compared to:
KS Value
(3.7)
The regional value is compared to the Kansas State value.
County: Hodgeman Asthma: Medicare Population
County: Hodgeman Asthma: Medicare Population
6.0%
(2022)
Compared to:
KS Counties
The distribution is based on data from 105 Kansas counties.
U.S. Counties
The distribution is based on data from 3,129 U.S. counties and county equivalents.
KS Value
(6.0%)
The regional value is compared to the Kansas State value.
US Value
(7.0%)
The regional value is compared to the national value.
Prior Value
(6.0%)
Prior Value compares a measured value with the previously measured value. Confidence intervals were not taken into account in determining the direction of the comparison.
Trend
This comparison measures the indicator’s values over multiple time periods.<br>The Mann-Kendall Test for Statistical Significance is used to evaluate the trend<br>over 4 to 10 periods of measure, subject to data availability and comparability.
County: Hodgeman Chronic Obstructive Pulmonary Disease (COPD) Hospital Admission Rate
County: Hodgeman Chronic Obstructive Pulmonary Disease (COPD) Hospital Admission Rate
48.1
Per 10,000 population
(2018-2020)
Compared to:
KS Value
(9.8)
The regional value is compared to the Kansas State value.
Prior Value
(48.2)
Prior Value compares a measured value with the previously measured value. Confidence intervals were taken into account in determining the direction of the comparison.
County: Hodgeman COPD: Medicare Population
County: Hodgeman COPD: Medicare Population
19.0%
(2022)
Compared to:
KS Counties
The distribution is based on data from 105 Kansas counties.
U.S. Counties
The distribution is based on data from 3,129 U.S. counties and county equivalents.
KS Value
(12.0%)
The regional value is compared to the Kansas State value.
US Value
(11.0%)
The regional value is compared to the national value.
Prior Value
(20.0%)
Prior Value compares a measured value with the previously measured value. Confidence intervals were not taken into account in determining the direction of the comparison.
Trend
This comparison measures the indicator’s values over multiple time periods.<br>The Mann-Kendall Test for Statistical Significance is used to evaluate the trend<br>over 4 to 10 periods of measure, subject to data availability and comparability.
County: Hodgeman Pneumonia (Bacterial) Hospital Admission Rate
County: Hodgeman Pneumonia (Bacterial) Hospital Admission Rate
67.6
Per 10,000 population
(2018-2020)
Compared to:
KS Value
(20.2)
The regional value is compared to the Kansas State value.
Prior Value
(55.5)
Prior Value compares a measured value with the previously measured value. Confidence intervals were taken into account in determining the direction of the comparison.
County: Hodgeman
Health / Sexually Transmitted Infections
Value
Compared to:
County: Hodgeman Sexually Transmitted Disease Rate
County: Hodgeman Sexually Transmitted Disease Rate
1.1
Cases per 1,000 population
(2022)
Compared to:
KS Value
(6.7)
The regional value is compared to the Kansas State value.
Prior Value
(2.3)
Prior Value compares a measured value with the previously measured value. Confidence intervals were not taken into account in determining the direction of the comparison.
Trend
This comparison measures the indicator’s values over multiple time periods.<br>The Mann-Kendall Test for Statistical Significance is used to evaluate the trend<br>over 4 to 10 periods of measure, subject to data availability and comparability.
County: Hodgeman
Health / Tobacco Use
Value
Compared to:
County: Hodgeman Adults who Smoke
County: Hodgeman Adults who Smoke
15.1%
(2021)
Compared to:
KS Counties
The distribution is based on data from 105 Kansas counties.
U.S. Counties
The distribution is based on data from 3,074 U.S. counties and county equivalents.
US Value
(13.5%)
The regional value is compared to the national value.
HP 2030 Target
(6.1%)
<div>TU-02: Reduce current cigarette smoking in adults <strong>(LEADING HEALTH INDICATOR)</strong></div>
County: Hodgeman Cigarette Spending-to-Income Ratio
County: Hodgeman Cigarette Spending-to-Income Ratio
2.3%
(2023)
Compared to:
KS Counties
The distribution is based on data from 105 Kansas counties.
U.S. Counties
The distribution is based on data from 3,141 U.S. counties and county equivalents.
KS Value
(2.2%)
The regional value is compared to the Kansas State value.
Prior Value
(2.4%)
Prior Value compares a measured value with the previously measured value. Confidence intervals were not taken into account in determining the direction of the comparison.
County: Hodgeman
Health / Weight Status
Value
Compared to:
County: Hodgeman Adults 20+ Who Are Obese
County: Hodgeman Adults 20+ Who Are Obese
23.5%
(2021)
Compared to:
KS Counties
The distribution is based on data from 105 Kansas counties.
U.S. Counties
The distribution is based on data from 3,074 U.S. counties and county equivalents.
Prior Value
(25.2%)
Prior Value compares a measured value with the previously measured value. Confidence intervals were taken into account in determining the direction of the comparison.
Trend
This comparison measures the indicator’s values over multiple time periods.<br>The Mann-Kendall Test for Statistical Significance is used to evaluate the trend<br>over 4 to 10 periods of measure, subject to data availability and comparability.
HP 2030 Target
(36.0%)
County: Hodgeman
Health / Wellness & Lifestyle
Value
Compared to:
County: Hodgeman Frequent Physical Distress
County: Hodgeman Frequent Physical Distress
10.4%
(2019)
Compared to:
KS Counties
The distribution is based on data from 105 Kansas counties.
U.S. Counties
The distribution is based on data from 3,121 U.S. counties and county equivalents.
KS Value
(11.0%)
The regional value is compared to the Kansas State value.
US Value
(12.0%)
The regional value is compared to the national value.
Prior Value
(10.7%)
Prior Value compares a measured value with the previously measured value. Confidence intervals were taken into account in determining the direction of the comparison.
County: Hodgeman Insufficient Sleep
County: Hodgeman Insufficient Sleep
30.7%
(2020)
Compared to:
KS Counties
The distribution is based on data from 105 Kansas counties.
U.S. Counties
The distribution is based on data from 3,140 U.S. counties and county equivalents.
KS Value
(33.0%)
The regional value is compared to the Kansas State value.
US Value
(33.0%)
The regional value is compared to the national value.
Prior Value
(33.0%)
Prior Value compares a measured value with the previously measured value. Confidence intervals were not taken into account in determining the direction of the comparison.
HP 2030 Target
(26.7%)
County: Hodgeman Poor Physical Health: 14+ Days
County: Hodgeman Poor Physical Health: 14+ Days
10.9%
(2021)
Compared to:
KS Counties
The distribution is based on data from 105 Kansas counties.
U.S. Counties
The distribution is based on data from 3,074 U.S. counties and county equivalents.
US Value
(10.9%)
The regional value is compared to the national value.
County: Hodgeman Self-Reported General Health Assessment: Poor or Fair
County: Hodgeman Self-Reported General Health Assessment: Poor or Fair
15.1%
(2021)
Compared to:
KS Counties
The distribution is based on data from 105 Kansas counties.
U.S. Counties
The distribution is based on data from 3,074 U.S. counties and county equivalents.
US Value
(16.1%)
The regional value is compared to the national value.
County: Hodgeman
Community
Value
Compared to:
County: Hodgeman Child Opportunity Index
County: Hodgeman
Community / Civic Engagement
Value
Compared to:
County: Hodgeman Voter Turnout: Presidential Election
County: Hodgeman Voter Turnout: Presidential Election
74.9%
(2016)
Compared to:
KS Counties
The distribution is based on data from 105 Kansas counties.
KS Value
(67.4%)
The regional value is compared to the Kansas State value.
Prior Value
(71.3%)
Prior Value compares a measured value with the previously measured value. Confidence intervals were not taken into account in determining the direction of the comparison.
Trend
This comparison measures the indicator’s values over multiple time periods.<br>The Mann-Kendall Test for Statistical Significance is used to evaluate the trend<br>over 4 to 10 periods of measure, subject to data availability and comparability.
HP 2030 Target
(58.4%)
<div>SDOH-07: Increase the proportion of the voting-age citizens who vote</div>
County: Hodgeman
Community / Crime & Crime Prevention
Value
Compared to:
County: Hodgeman Rate of Violent Crime per 1,000 Population
County: Hodgeman Rate of Violent Crime per 1,000 Population
2.8
Crimes per 1,000 population
(2021)
Compared to:
KS Value
(4.6)
The regional value is compared to the Kansas State value.
US Value
(3.7 in 2015)
The Kansas State value is compared to the US value. Under reporting of crime by some public safety jurisdictions may result in lower rates.
Prior Value
(1.7)
Prior Value compares a measured value with the previously measured value. Confidence intervals were not taken into account in determining the direction of the comparison.
Trend
This comparison measures the indicator’s values over multiple time periods.<br>The Mann-Kendall Test for Statistical Significance is used to evaluate the trend<br>over 4 to 10 periods of measure, subject to data availability and comparability.
County: Hodgeman
Community / Demographics
Value
Compared to:
County: Hodgeman Average Household Size
County: Hodgeman Average Household Size
2.50
Persons per household
(2018-2022)
Compared to:
KS Value
(2.50)
The regional value is compared to the Kansas State value.
US Value
(2.60)
The regional value is compared to the national value.
Trend
This comparison measures the indicator’s values over multiple time periods.<br>The Mann-Kendall Test for Statistical Significance is used to evaluate the trend<br>over 4 to 10 periods of measure, subject to data availability and comparability.
County: Hodgeman Female Population
County: Hodgeman Female Population
48.1%
(2022)
Compared to:
KS Value
(49.8%)
The regional value is compared to the Kansas State value.
US Value
(50.4%)
The regional value is compared to the national value.
Prior Value
(48.4%)
Prior Value compares a measured value with the previously measured value. Confidence intervals were not taken into account in determining the direction of the comparison.
Trend
This comparison measures the indicator’s values over multiple time periods.<br>The Mann-Kendall Test for Statistical Significance is used to evaluate the trend<br>over 4 to 10 periods of measure, subject to data availability and comparability.
County: Hodgeman Foreign Born Persons
County: Hodgeman Foreign Born Persons
3.4%
(2018-2022)
Compared to:
KS Value
(7.1%)
The regional value is compared to the Kansas State value.
US Value
(13.7%)
The regional value is compared to the national value.
Trend
This comparison measures the indicator’s values over multiple time periods.<br>The Mann-Kendall Test for Statistical Significance is used to evaluate the trend<br>over 4 to 10 periods of measure, subject to data availability and comparability.
County: Hodgeman Households
County: Hodgeman Households
710
Households
(2018-2022)
Compared to:
Trend
This comparison measures the indicator’s values over multiple time periods.<br>The Mann-Kendall Test for Statistical Significance is used to evaluate the trend<br>over 4 to 10 periods of measure, subject to data availability and comparability.
County: Hodgeman Male Population
County: Hodgeman Male Population
51.9%
(2022)
Compared to:

KS Value
(50.2%)
The regional value is compared to the Kansas State value.
US Value
(49.6%)
The regional value is compared to the national value.
Prior Value
(51.6%)
Prior Value compares a measured value with the previously measured value. Confidence intervals were not taken into account in determining the direction of the comparison.
Trend
This comparison measures the indicator’s values over multiple time periods.<br>The Mann-Kendall Test for Statistical Significance is used to evaluate the trend<br>over 4 to 10 periods of measure, subject to data availability and comparability.
County: Hodgeman Population Age 5+ with Language Other than English Spoken at Home
County: Hodgeman Population Age 5+ with Language Other than English Spoken at Home
6.7%
(2018-2022)
Compared to:
KS Value
(11.8%)
The regional value is compared to the Kansas State value.
US Value
(21.7%)
The regional value is compared to the national value.
